Figure 7.
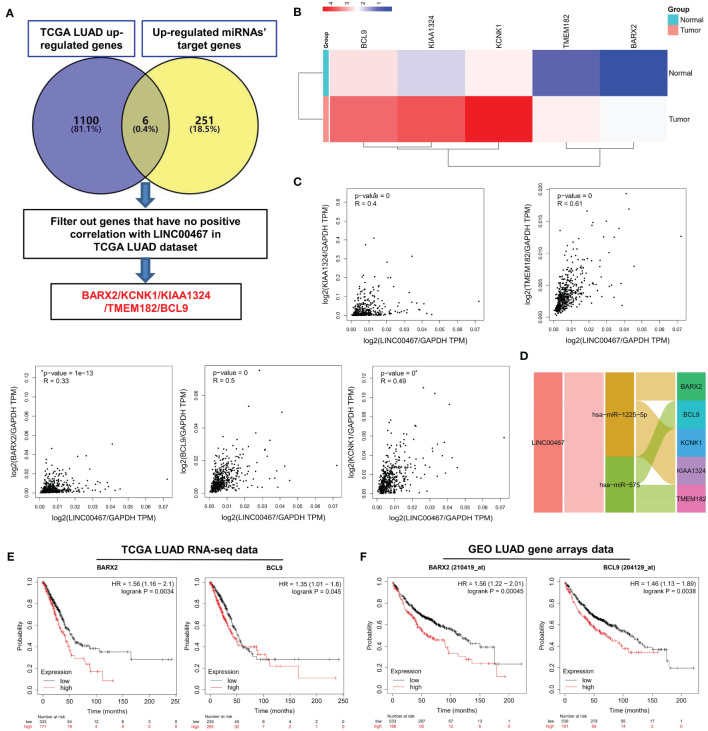
Screening of LUAD prognostic biomarkers in the LINC00467-mediated ceRNA network. (A) Flowchart for the identification and analysis of candidate genes. (B) Multiple gene comparison analysis was performed using GEPIA2, which revealed the expression of the candidate genes in LUAD tumor versus normal tissues. The density of color in each block represents the median expression value. T indicates tumour and N indicates normal. Use log2(TPM+1) transformed expression data for plotting; (C) Correlation analysis was performed via GEPIA2, which indicated the relationships between the expression levels of the candidate genes and LINC00467 in LUAD. (D) Sankey diagram for the LINC00467 ceRNA network. Each rectangle represents a gene, and the connection degree of each gene is visualized based on the size of the rectangle. Kaplan-Meier curve of the TCGA RNA-seq (E) and Gene Expression Omnibus LUAD gene arrays (F) data, revealing that BARX2 and BCL9 expression correlate with overall survival. The horizontal axis indicates the overall survival time in months, and the vertical axis indicates the survival rate.

