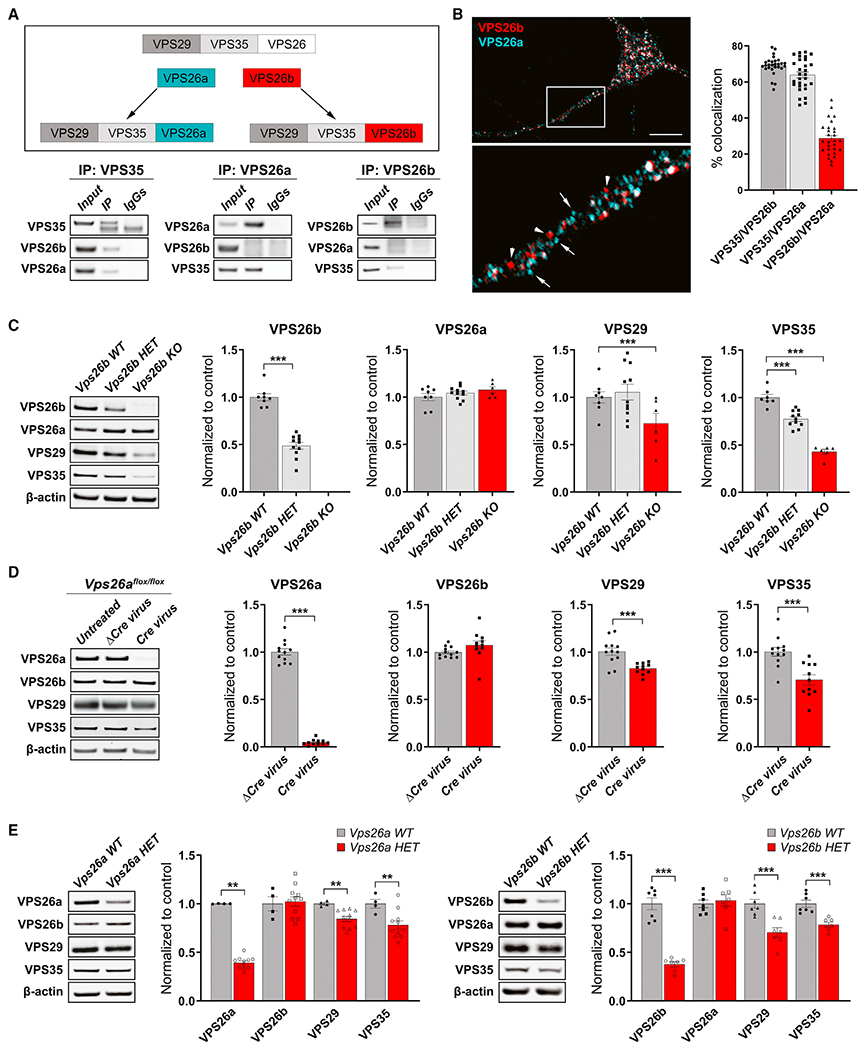
Figure 1. VPS26b and VPS26a define distinct retromer cores.

(A) An illustration of the proposed hypothesis for how the VPS26 paralogs form two separate retromer cores (top panel). Co-immunoprecipitation analysis of retromer proteins extracted from primary neuronal cultures using VPS35 (10 μg; left panel), VPS26a (10 μg; middle panel), and VPS26b (10μg; right panel) as baits (bottom panel) support this hypothesis.
(B) A representative confocal image showing partial co-localization of both VPS26 paralogs (left panel), while quantitative colocalization studies, based on Pearson’s correlation, reveal that VPS35 shows a higher percentage of co-localization with each VPS26 paralog (n = 28–29 cells, from three independent experiments) (right panel). Scale bar, 10 μm.
(C) Support for VPS26b forming a distinct retromer core is shown by how a primary depletion of VPS26b, in primary cultures derived from Vps26b heterozygous (HET) mice (n = 6) or Vps26b KO mice (n = 6) compared with Vps26b WT mice (n = 8), has no effect on VPS26a but causes a secondary reduction in VPS29 and VPS35, as summarized in the bar graphs and illustrated by representative immunoblots (in a one-way ANOVA with Tukey’s post hoc test’s two-sided analysis).
(D) Support for VPS26a forming a distinct retromer core is shown by how a primary depletion of VPS26a, induced by infecting neurons from Vps26aflox/flox mice with a lentivirus-expressing Cre recombinase (Cre, n = 11), compared with neurons infected with a lentivirus expressing a catalytically dead Cre recombinase (ΔCre, n = 12), has no effect on VPS26b (p = 0.1480, in an unpaired t test with Welch’s correction) but causes a secondary reduction in VPS29 and VPS35, as summarized in the bar graphs and illustrated with representative immunoblots. Statistical analyses were performed using either unpaired two-sided Student’s t test, with Welch’s correction when required, or a non-parametric Mann-Whitney t test.
(E) Western blots of hippocampus homogenates from Vps26a and Vps26b HET mice (Vps26a WT, n = 4; Vps26a HET, n = 11; Vps26b WT, n = 7; Vps26b HET, n = 7). Quantitative analysis of the western blots probed for retromer proteins shows that a primary deficiency in VPS26a (p = 0.0015) results in a secondary reduction VPS35 (p = 0.0037) and VPS29 (p = 0.0061) but not VPS26b (p = 0.8101), while a primary deficiency in VPS26b (p < 0.0001) results in a secondary reduction in VPS35 (p = 0.0004) and VPS29 (p = 0.0009) but not VPS26a (p = 0.6373), arguing in favor of separate retromer cores. All statistical analysis were performed using two-sided Student’s t test except for VPS26a in the Vps26a WT versus Vps26a HET analysis. Values denote mean ± SEM, where *p < 0.05, **p < 0.01, and ***p < 0.001.
See also Figures S1 and S2.
