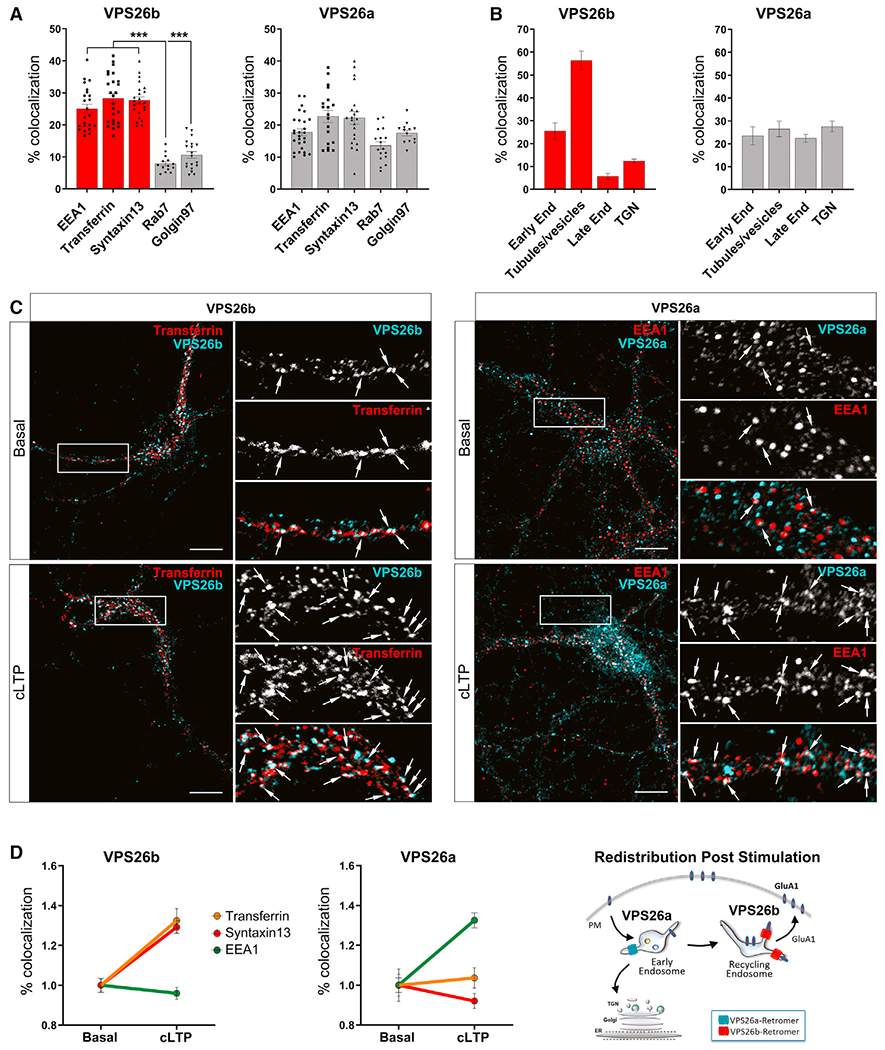
Figure 2. VPS26b redistributes to recycling endosomes during neuronal stimulation.

(A and B) Subcellular distribution of both VPS26 paralogs was performed using confocal and ultracryomicrotomy analyses.
(A) Confocal microscopy quantifications based on Pearson’s correlation coefficient were obtained by analysis of 15–27 cells per group/condition. Kruskal-Wallis test with a Dunn’s post hoc test was used for the statistical analysis. Note that while VPS26a is broadly detected in all different compartments, VPS26b is highly enriched in early (EEA1) and recycling (Syntaxin13 and pulse-chase transferrin) endosomes, with less presence in the trans-Golgi network (Golgin97) and late endosomes (Rab7). Data expressed as mean ± SEM. *p < 0.05, **p < 0.01, and ***p < 0.001.
(B) Immunogold labeling quantifications (percetange of gold particles) for VPS26b and VPS26a on ultrathin cryosections shown in Figure S3B. Localization of an equivalent number of gold particles in each sample was assessed relative to the indicated cell compartment. Note that whereas the bulk of VPS26b localizes to tubular-vesicular structures found at the vicinity of endosomes, VPS26a is broadly distributed among the different compartments.
(C) Primary hippocampal neurons were stimulated with glycine for 5 min to induce cLTP, and the subcellular distribution of VPS26b and VPS26a was assessed by confocal microscopy using markers of early (EEA1) and recycling (Syntaxin13 and pulse-chase transferrin) endosomes. Compared to basal conditions, cLTP caused VPS26b to increase its co-localization with markers of the recycling endosomes (in an ANOVA analysis; pulse-chase transferrin: F[1,33] = 20.7, p = 6.9E−5; Syntaxin13: F[1,36] = 38.8, p = 3.5E−7) and caused VPS26a to increase its co-localization with a marker of early endosomes (EEA1: F[1,33] = 24.5, p = 2.1E−5), as illustrated in the representative confocal images of dendritic segments. Arrows indicate sites of co-localization. Scale bar, 10μm (top panel).
(D) Co-localization studies based on Pearson’s correlation coefficient were used to generate the line graphs (n = 31–41 cells per condition, from four independent experiments) (left panels). An illustration of the changes in distribution observed post-stimulation for both VPS26 paralogs is shown (right panel).
See also Figures S3 and S4.
