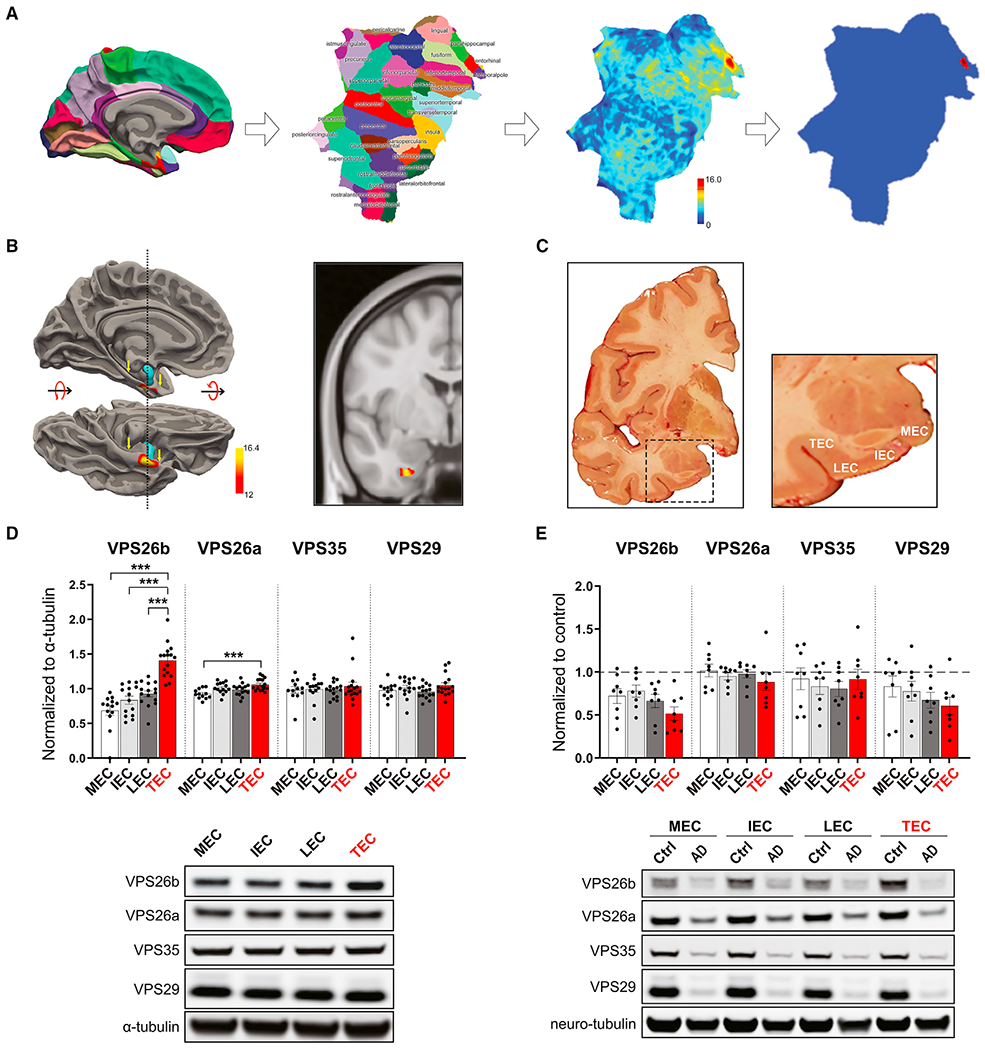
Figure 6. VPS26b is the AD-targeted trans-entorhinal cortex.

(A) 3D cortical surface. Cortical map. A 3D rendering of the cortical surface, parcellated into color-coded cortical regions, and shown in a medial view (first panel). Cortical flat map. The 3D surface of a unilateral cortical surface is shown flattened and rendered as a “flat-map” so that all cortical regions can be viewed in a single snapshot. Individual cortical regions are color-coded as labeled (second panel). Raw t value map comparing AD versus controls. A color-coded map of t values was generated comparing the cortical thickness of AD versus controls and co-varying for sex and age (color bar represents t values of the between-group comparisons; the dashed line indicates the threshold t = 12 to generate the thresholded t value map; see STAR Methods) (third panel). Thresholded t value map comparing AD versus controls. By thresholding the t value map, the most reliable cortical thinning in AD versus controls is localized to the vicinity of the TEC (fourth panel).
(B) The Alzheimer’s-targeted TEC was isolated by performing a cortical thickness analysis of MRIs generated from 188 patients with AD and 169 healthy controls. Its longitudinal extent is indicated by the yellow arrows, where the entorhinal cortex abuts the amygdala (the highlighted blue region) (left panel). Pixels with the most reliable volumetric loss compared with controls are indicated in yellow/red (the color bar represents t values of the between-group comparisons), and the TEC defect is also shown on a coronal MRI slice (right panel).
(C) A representative human postmortem brain slice matching the precise anatomical coordinates of the neuroimaging finding (left panel) with the subregions of the entorhinal cortex harvested for protein measurements shown in higher magnification (right panel): the TEC, the lateral EC (LEC), the intermediate EC (IEC), and the medial EC (MEC).
(D) In healthy controls (n = 16), among the four retromer core proteins, the TEC was found differentially enriched in VPS26b (p < 0.0001) in a non-parametric Kruskal-Wallis with Dunn’s post hoc test, as summarized in the bar graph showing mean levels normalized to α-tubulin (top panel) and illustrated with representative immunoblots (bottom panel).
(E) An ANOVA analysis revealed that, compared with age-matched healthy controls (n = 9), AD brains (n = 8) showed the most reliable reduction in the TEC’s VPS26b (F[1,16] = 12.96, p = 0.002), as summarized in the brain graphs showing normalized means (top graph) and illustrated with representative immunoblots (bottom panel) (stippled lines represent the mean of the healthy controls). Data expressed as mean ± SEM. *p < 0.05, **p < 0.01, and ***p < 0.001.
