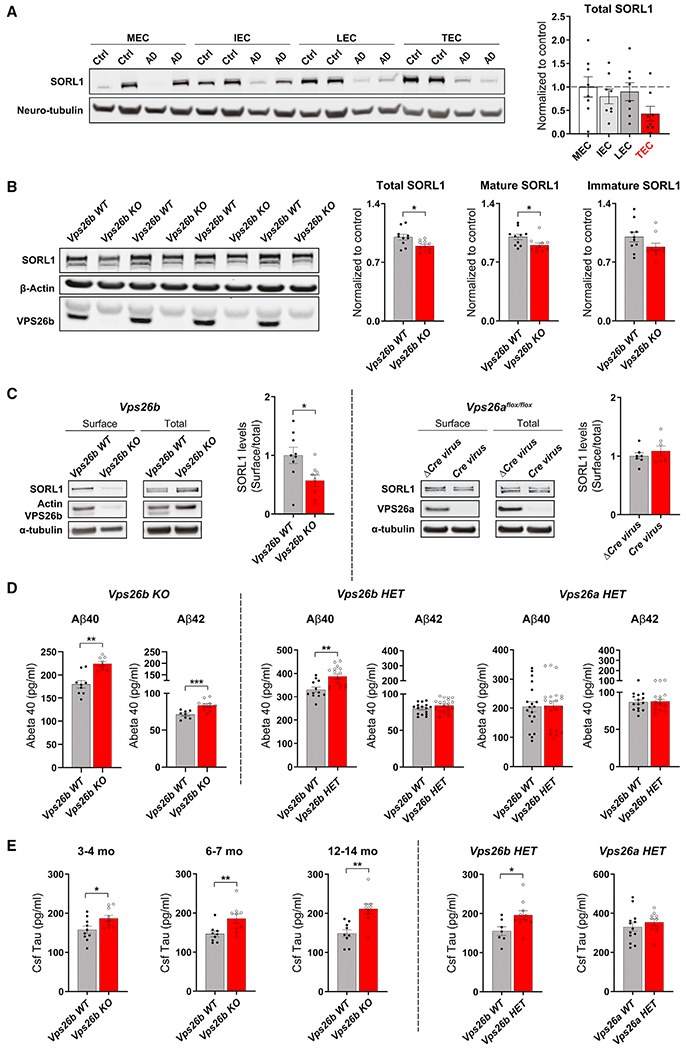
Figure 7. VPS26b mediates Alzheimer’s-related pathologies.

(A) Western blotting analysis of different subregions of the entorhinal cortex from healthy controls and patients with AD immunoblotted for SORL1 protein is shown. TEC, trans-EC; LEC; lateral EC; IEC, intermediate EC; MEC, medial EC (left panel). An ANOVA analysis revealed that, compared with age-matched healthy controls (n = 9), AD brains (n = 8) showed a significant and reliable reduction of SORL1 in the TEC region compared with other EC subregions (F[1,16] = 12.32, p = 0.003, as summarized in the brain graphs showing normalized means). Stippled lines represent the mean of the healthy controls (right panel).
(B) Quantitative analysis of SORL1 immunoblots from 7- to 9-month-old mice showing a reduction of SORL1 in the entorhinal cortex of Vps26b KO compared with Vps26b WT mice (total SORL1: p = 0.0160, in an unpaired two-sided Student’s t test; mature SORL1: p = 0.0185, in a on parametric Mann Whitney test; immature SORL1: p = 0.1167, in an unpaired two-sided Student’s t test).
(C) Biotinylated cell-surface proteins were immunoprecipitated from total lysates of cortical neurons depleted for VPS26b (n = 8–9 biological replicates) or VPS26a (n = 7 biological replicates). Western blot analysis revealed that only VPS26b (p = 0.0274, in a two-tailed non-parametric Mann Whitney test), but not VPS26a (p = 0.9755, in a two-tailed non-parametric Mann Whitney test), depletion results in a decrease in SORL1 cell-surface levels.
(D) Bar graph showing the levels of Aβ40 and Aβ42 levels measured by ELISA from entorhinal cortex homogenates harvested from Vps26b KO mice and control littermates at 6–7 months (Aβ40 measurements: Vps26b WT [n = 9] versus Vps26b KO [n = 9], p = 0.0002 in a two-tailed non-parametric Mann Whitney test; for Aβ42 measurements: Vps26b WT [n = 8] versus Vps26b KO [n = 10], p = 0.0013). Data expressed as mean ± SEM from 2–4 independent experiments (left panel). Bar graph showing the levels of entorhinal Aβ40 and Aβ42 measured by ELISA harvested from Vps26b mice (Aβ40 measurements: Vps26b WT [n = 12] versus Vps26b HET [n = 16], p = 0.0011; Aβ42 measurements: Vps26b WT [n = 16] versus Vps26b HET [n = 20], p = 0.1203). Vps26a mice (Aβ40 measurements: Vps26a WT [n = 20] versus Vps26a HET [n = 19], p = 0.8886; Aβ42 measurements: Vps26a WT [n = 15] versus Vps26a HET [n = 15], p = 0.8059). Two-tailed unpaired Student’s t test was used for the statistical analysis (right panel).
(E) Bar graph showing tau CSF levels measured by Simoa technology from Vps26b KO mice and control littermates at 3–4 months: Vps26b WT (n = 10) versus Vps26b KO (n = 10), p = 0.0226, in a two-tailed unpaired Student’s t test; 6–7 months: Vps26b WT (n = 9) versus Vps26b KO (n = 9), in a two-tailed unpaired Student’s t test, p = 0.0056, in a non-parametric Mann Whitney test; and 12–14 months: Vps26b WT (n = 9) versus Vps26b KO (n = 9), **p = 0.0012, in a two-tailed unpaired Student’s t test (left panel). (F) Bar graph showing tau CSF levels measured by Simoa technology from Vps26 HET mice at 9–12 months. Vps26b mice (Vps26b WT[n = 7] versus Vps26b HET [n = 10], p = 0.0270) and Vps26a mice (Vps26a WT [n = 13] versus Vps26a HET [n = 10], p = 0.4169). Two-tailed unpaired Student’s t test was used for all statistical analysis (right panel). Data expressed as mean ± SEM. *p < 0.05, **p < 0.01, and ***p < 0.001.
