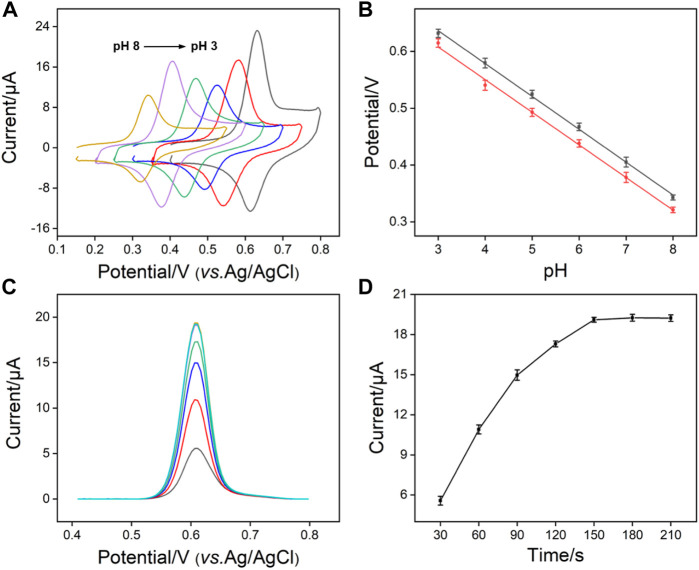
FIGURE 5.
(A) CV curves of APAP (20 μM) obtained on SNF/CDG/AuF in 0.1 M PBS at various pH values. (B) The plots of anodic and cathodic peak potential with pH values. (C) DPV curves and oxidation peak currents (D) measured on SNF/CDG/AuF towards APAP (20 μM) in 0.1 M PBS (pH 3.0) at different accumulation time.

