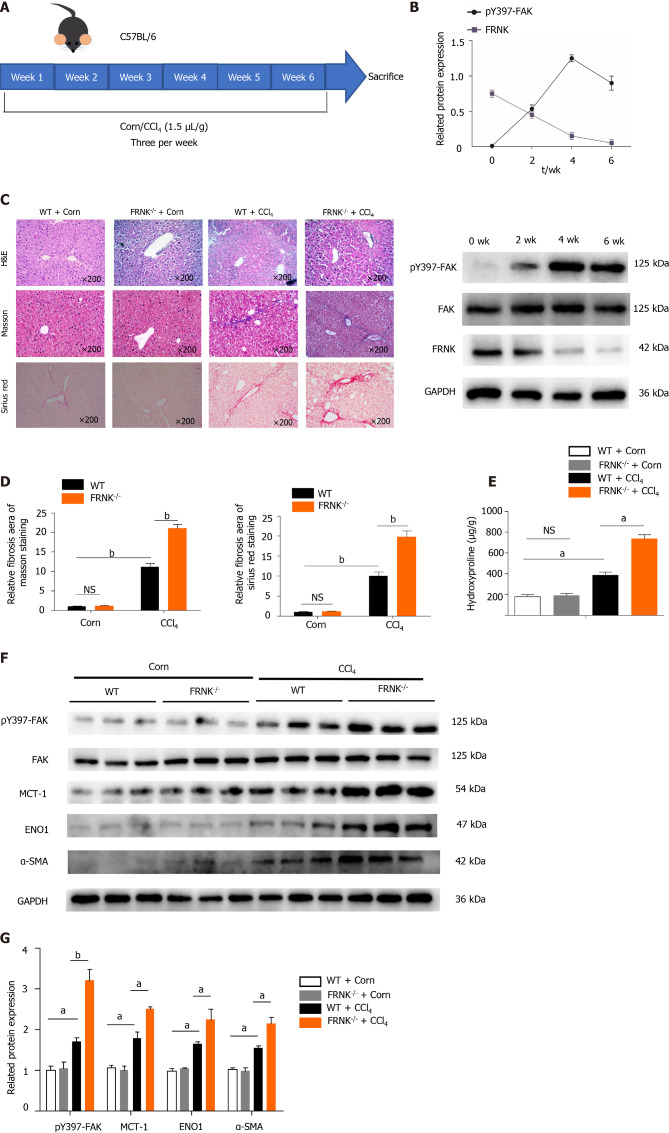
Figure 2.
Liver fibrosis in mice was aggravated after FRNK knockout. A and B: WT mice were modeled for 6 wk, pY397-FAK and FRNK protein expression levels in vivo was measured using Western blotting every fortnight; C and D: FRNK-/- and WT mice were used to establish a liver fibrosis model by administering CCl4 (1.5 μL/g), and liver tissues from these mice were stained with H&E, Masson’s trichrome, and Sirius Red after 4 wk and observed under a light microscope × 200 magnification. The relative fibrotic areas were analyzed; E: The hydroxyproline content in liver tissues from the liver fibrosis model was also measured; F and G: Western blotting was used to detect the relative expression of proteins in the liver fibrosis model established with FRNK-/- mice and WT mice. Representative results from three independent replicate assays are shown (n = 6). aP < 0.05 and bP < 0.01. Data are presented as the mean ± SD. MCT-1: Monocarboxylate transporter-1; ENO1: Enolase1.

