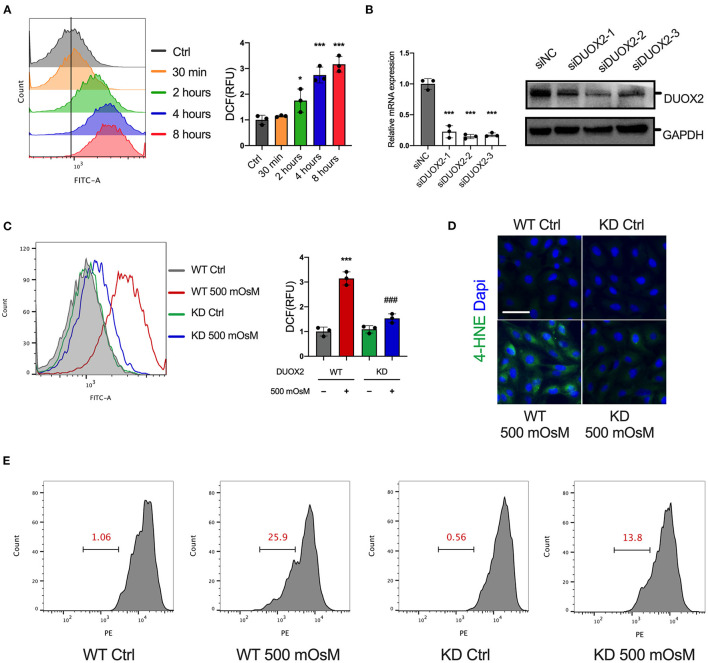
Figure 3.
Elevation of DUOX2 triggers oxidative stress in HCE cells. (A) Reactive oxygen species (ROS) levels were measured in HCE cells exposed to normal medium (Ctrl) or hyperosmotic medium (500 mOsM) for the indicated times by 2′,7′-dichlorofluorescein diacetate (H2DCFDA) using flow cytometry. Right: relative fluorescence units (RFUs) were monitored. (B) HCE cells were transfected with different siRNAs targeted to DUOX2 or negative control (siNC) for 24 h. The expression of DUOX2 was examined by RT-PCR and western blot. Wild-type (WT) and DUOX2-knockdown (KD) HCE cells were exposed to hyperosmotic medium (500 mOsM) or normal medium (Ctrl) for 6 h. (C) ROS levels were measured by flow cytometry. Right: RFUs were monitored. (D) Representative fluorescence images showing the change of 4-hydroxynonenal (4-HNE). (E) Mitochondrial membrane potential (MMP) was evaluated by TMRE staining using flow cytometry. Scale bar = 100 μm. The data shown are representative of three or more independent experiments (mean ± SD). *p < 0.05 and ***p < 0.001 vs. untreated controls; ###p < 0.001 vs. 500 mOsM(+) DDIT4 KD(–).

