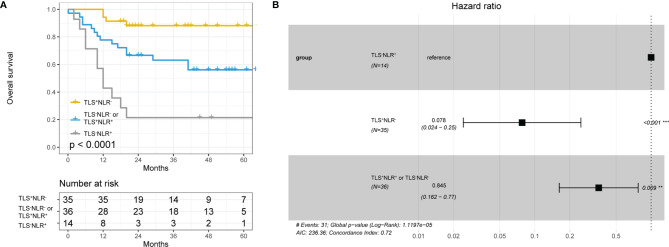
Figure 4.
(A) Kaplan–Meier curve using the best cutoff value of lymphocyte ratio (NLR) determined by Figures 2A , 3A group1 is patients in the TLS+NLR- group, group2 is patients in the TLS-NLR+ or TLS+NLR+ group, and group3 is patients in the TLS-NLR+ group. (B) Hazard ratios and 95% CI in the three subgroups.

