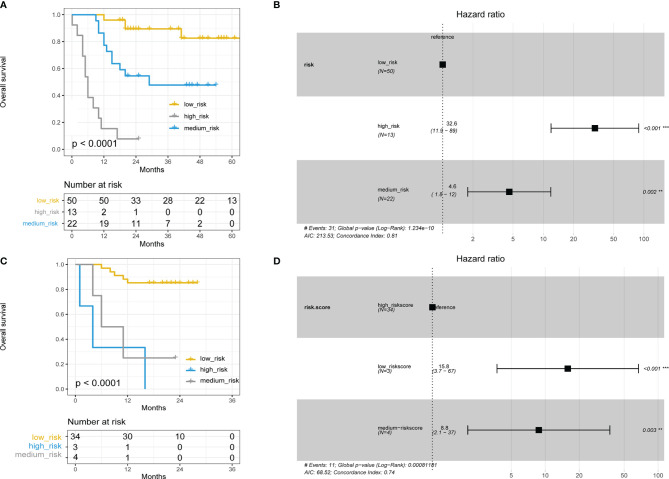
Figure 6.
(A) Kaplan–Meier curve using the tertile of the model-predicted score (Training set). Patients were grouped into low-risk, medium-risk, and high-risk groups. (B) Hazard ratios and 95% CI in the three subgroups (Training set). (C) Kaplan–Meier curve using the tertile of the model-predicted score (Validation set). Patients were grouped into low-risk, medium-risk, and high-risk groups. (D) Hazard ratios and 95% CI in the three subgroups (Validation set).

