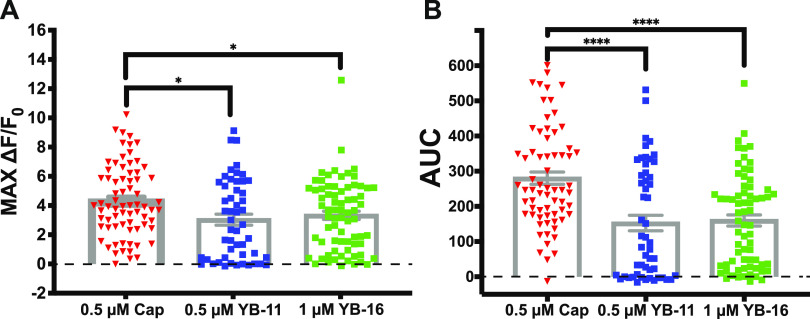
Figure 11.
Impact of YB-11 and YB-16 on the dorsal root ganglion Ca2+ influx assessed with in vitro Ca2+ imaging. (A) The max Ca2+ signal from YB-11 and YB-16 was significantly reduced compared to that from capsaicin (one-way ANOVA P = 0.011). (B) The area under the curve (AUC) Ca2+ signal from YB-11 and YB-16 was significantly reduced compared to that from capsaicin (one-way ANOVA P < 0.0001). Dunnett’s multiple comparison *P < 0.05, ****P < 0.0001. Data are shown as mean ± SEM.

