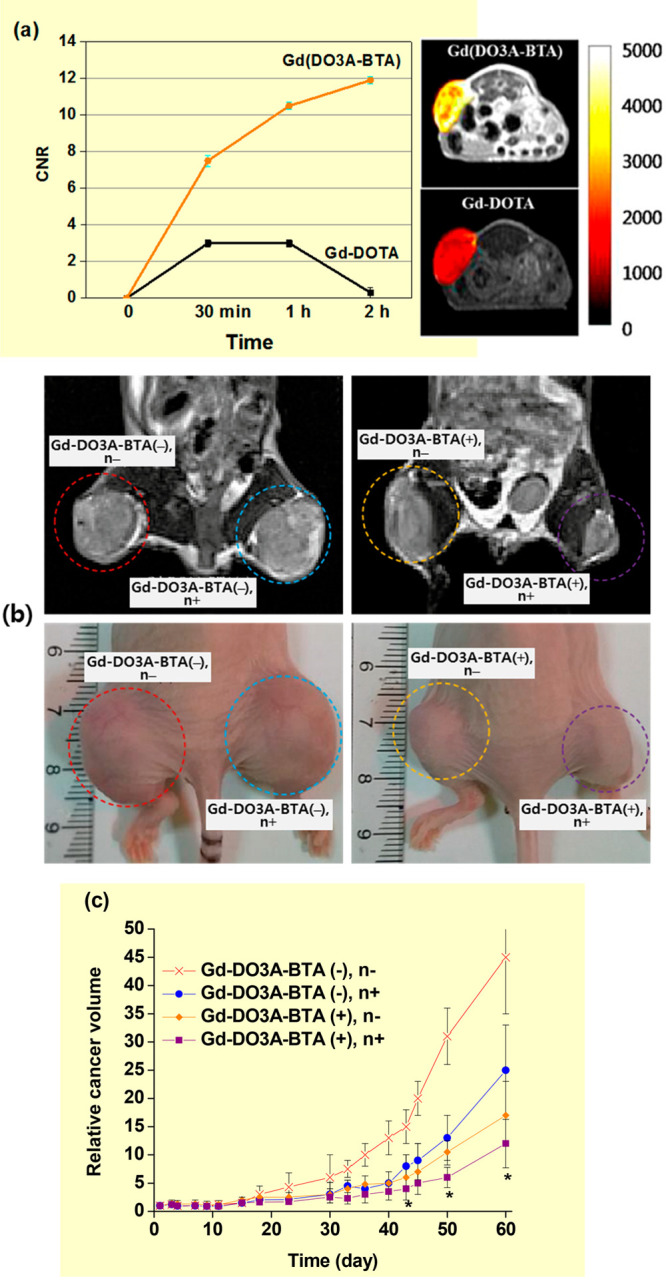
Figure 5.

(a) Plots of contrast-to-noise ratios (CNRs) of MDA-MB-231 cancers in mice with time after intravenous injection with Gd(DO3A)-BTA and Gd-DOTA (left) and T1 MR images of cancers in mice 1.0 h after intravenous injection (right). Adapted and reproduced from ref (21a). Copyright 2013 American Chemical Society. (b) T1 MR images (top) and photographs (bottom) of cancers on mouse thighs 60 days after thermal neutron beam irradiation: from the left, [Gd-DO3A-BTA(−), n−], [Gd-DO3A-BTA(−), n+], [Gd-DO3A-BTA(+), n−], and [Gd-DO3A-BTA(+), n+]. (c) Plots of relative cancer volumes (Vday/Vday=1) as a function of days after thermal neutron beam irradiation [N = 5, p* < 0.05 from Gd-DO3A-BTA(+), n−]. Adapted and reproduced with permission from ref (11j). Photograph courtesy of Ki-Hye Jung. Copyright 2018 Ki-Hye Jung et al.
