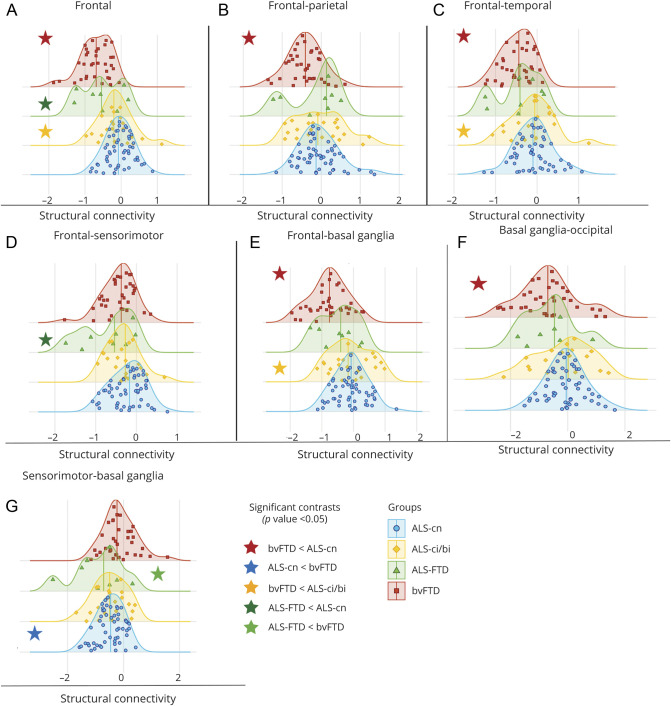
Figure 3. Distribution Analysis of the Structural Connectivity Damage in Patient Groups.
A–G) The distribution of structural connectivity alterations within frontal and motor areas and in the connections towards these areas is displayed. Distribution curves are normalized relative to control values. The more the curve is shifted towards negative values, the greater the structural damage. All significant contrasts (p < 0.05)—displayed with colored stars—are reported according to age-, sex-, and education-adjusted analysis of variance models, Bonferroni-corrected for multiple comparisons. ALS = amyotrophic lateral sclerosis; ALS-ci/bi = amyotrophic lateral sclerosis with cognitive or behavioral impairment; ALS-cn = amyotrophic lateral sclerosis with motor impairment only; ALS-FTD = amyotrophic lateral sclerosis with frontotemporal dementia; bvFTD = behavioral variant of frontotemporal dementia.

