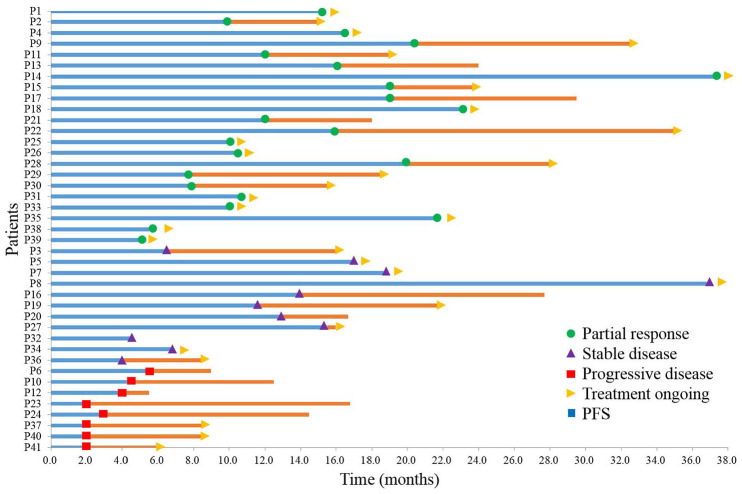
Figure 2.
Clinical course for patients received first-line chemotherapy with or without targeted therapy. Swimming plot depicts duration of treatment, and RECIST v1.1 status at the first scan (green circle = partial response, purple triangles = stable disease, red squares = progressive disease). Time of censoring is shown (yellow triangles = treatment ongoing). Patient 13, 17, 21, 16, 20, 32, 6, 10, 12, 23, and 24 died at the time of the data cutoff. Survival time is depicted as horizontal lines (blue = PFS1, blue plus orange = OS).

