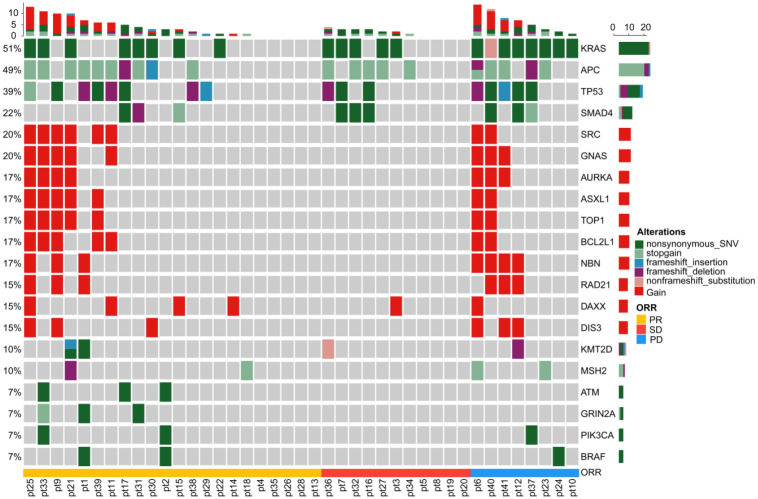
Figure 3.
The oncoprint diagrams of mutational profile at baseline of the 41 patients with mCRC. Upper panel: The frequency of listed driver genes. Middle panel: The matrix of mutations in a selection of frequently mutated genes. Each column represents one tumor sample, and each row represents one gene. Right panel: The total number of patients harboring mutations in each gene. Bottom annotation shows patient ID. Response to first-line treatment is also shown. PR, partial response; SD, stable disease; PD, progressive disease.

