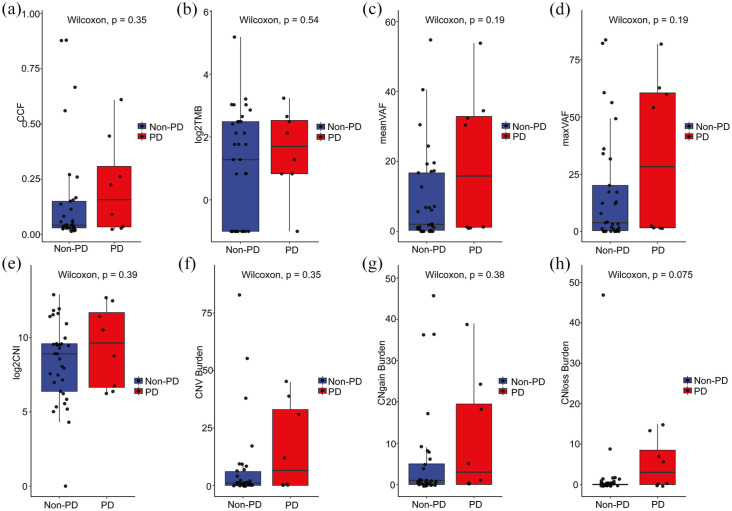
Figure 4.
Relationship between pretreatment mutational parameters and therapeutic response in 41 patients. (a) Box plot depicting the relationship between pretreatment CCF levels and clinical response. Each dot corresponds to one sample. (b) Correlation between TMB levels and therapeutic response. (c) Pretreatment VAF stratified by objective response (PR and SD versus PD) was not significantly associated with response in all patients. The horizontal bar represents the mean, the box represents the 25th and 75th percentiles, and whiskers ± 1.5 × interquartile range (IQR). (d) Pretreatment maximum VAF was not significantly associated with ORR in RECIST responders and nonresponders (p = 0.19). (e) There was no statistically significant difference between CNI levels and clinical benefit. (f), (g), and (h) The correlation between burden of tumor copy number changes (CNV, CNgain, and CNloss) and clinical benefit in all patients.

