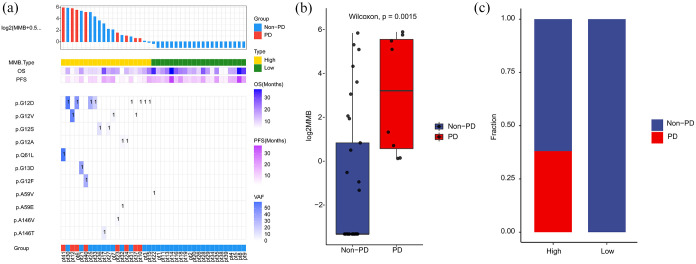
Figure 7.
High-KRAS molecular mutational burden was related to inferior response rate and shorter survival time. (a) Summary of mutation sites of KRAS identified by individual patient at baseline. The variant allele frequencies for each mutation site are plotted on the right panel. (b) Molecular mutational burden of KRAS was higher in PD group than non-PD group. (c) The distribution of patients with PD/non-PD in high-KRAS MMB and low-KRAS MMB subgroups.

