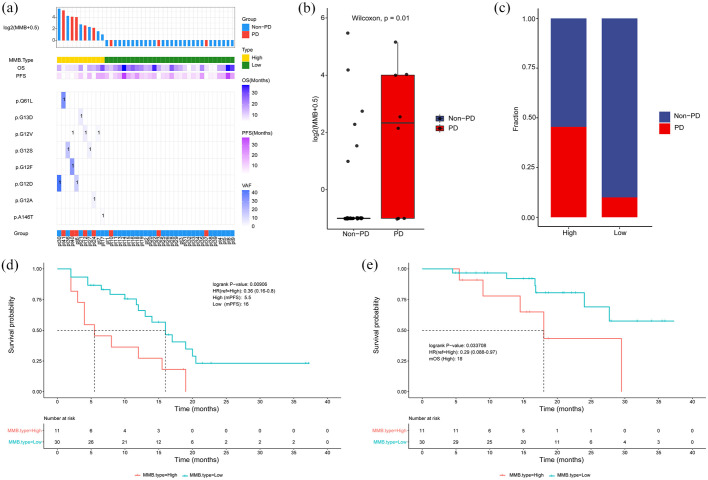
Figure 8.
Association between KRAS MMB and therapeutic response after four cycles of first-line treatment. (a) Summary of mutation sites of KRAS identified by individual patient after four cycles of first-line treatment. (b) KRAS MMB was lower in non-PD patients than PD patients. (c) The distribution of patients with PD/non-PD in MMB-high and MMB-low subgroups. (d) PFS was longer in patients with low-KRAS MMB than patients with high-KRAS MMB. (e) OS was longer in patients with low-KRAS MMB than patients with high-KRAS MMB.

