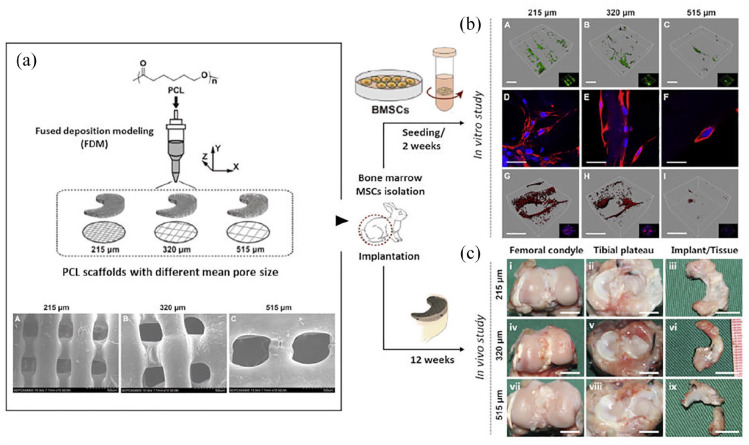
Figure 4.
Synthetic 3D printed bare scaffolds, development and validation. (a) Schematic illustration of in PCL scaffolds printing method; (A–C) different mean pore sizes is also showed through SEM microimages. (b) Effect of scaffold mean pore size on bone marrow stem cells (BMSC) colonization and collagen II deposition. (A–C) Representative 3D microimages of BMSC colonization and collagen II deposition in scaffolds with various mean pore sizes; the surface area covered by live BMSCs was the greatest on the 215 μm scaffold in all three groups. Green fluorescence marked live BMSCs (scale bar: 300 μm). (D–F) BMSCs colonized and bridged neighboring fibers in the former group, while those placed on the latter were isolated; red fluorescence, cytoskeleton; blue fluorescence, nuclei (scale bar: 50 μm). (G–I) The largest areas of synthesized matrices around the pores were shown in the 215 μm scaffold compared with the other two scaffolds. Red fluorescence, collagen II (scale bar: 300 μm). (c) Macroscopic images of joints and implants 12 weeks after surgery; better outcomes were displayed by 215 μm scaffolds. Scale bar: 10 mm.
Source: Adapted and reprinted with permission from Zhang et al. 25 Copyright 2016 Elsevier.

