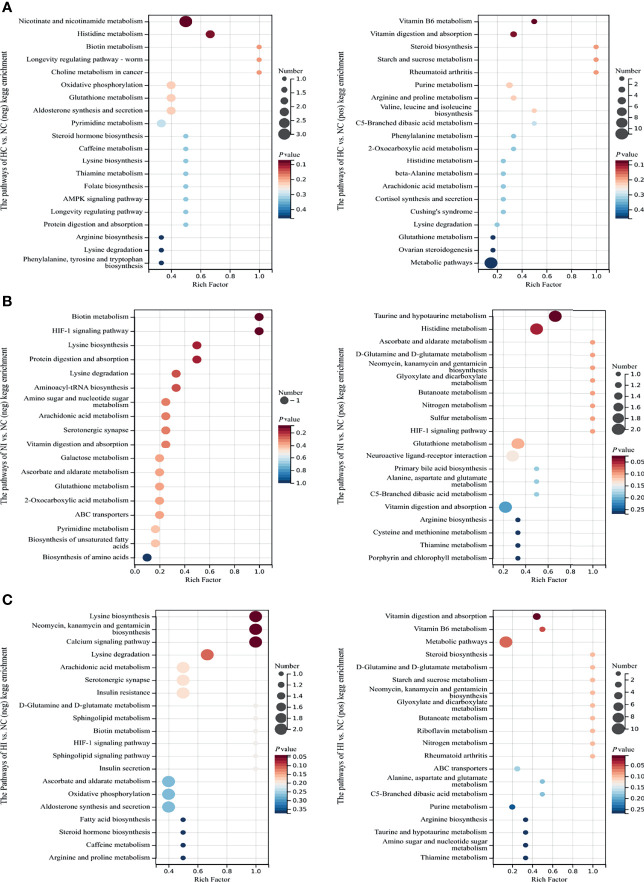
Figure 3.
The enriched top 18 or 20 KEGG pathways sorted by P value based on the differential metabolites of the three compared groups. The size of the point indicates the number of enriched metabolites. Rich Factor, the ratio of x to M. (A) The enriched KEGG pathways of NC versus HC. (B) The enriched KEGG pathways of NC versus NI. (C) The enriched KEGG pathways of NC versus HI.

