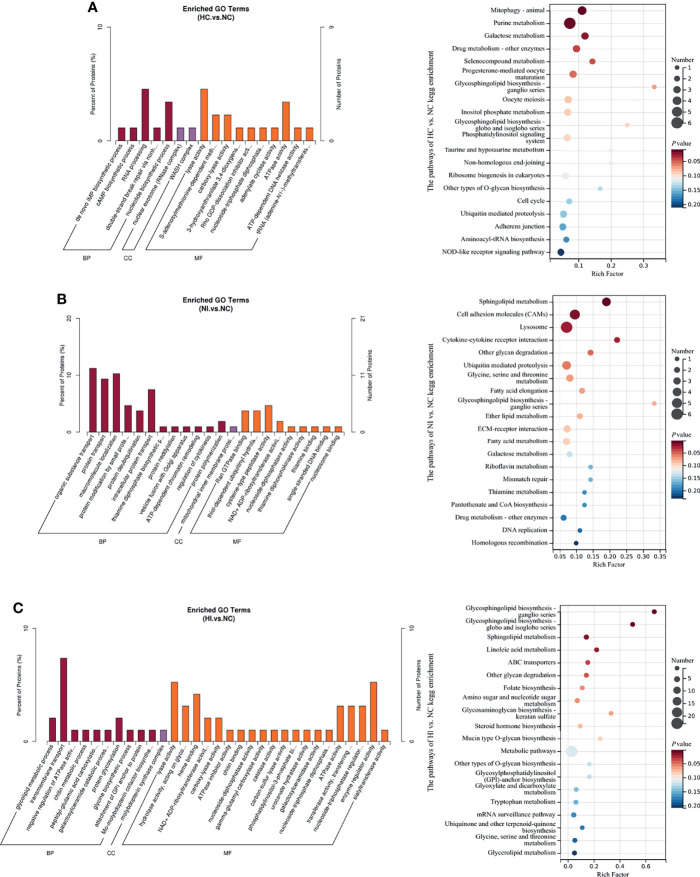
Figure 4.
The enriched GO terms (P value < 0.05) and top 20 KEGG pathways sorted by P value based on the differentially expressed proteins of the three compared groups. Percent of proteins: the ratio of x to n. The size of the point indicates the number of enriched metabolites. Rich Factor, the ratio of x to M; BP, biological process; CC, cellular component; MF, molecular function. (A) The enriched GO terms and KEGG pathways of NC versus HC. (B) The enriched GO terms and KEGG pathways of NC versus NI. (C) The enriched GO terms and KEGG pathways of NC versus HI.

