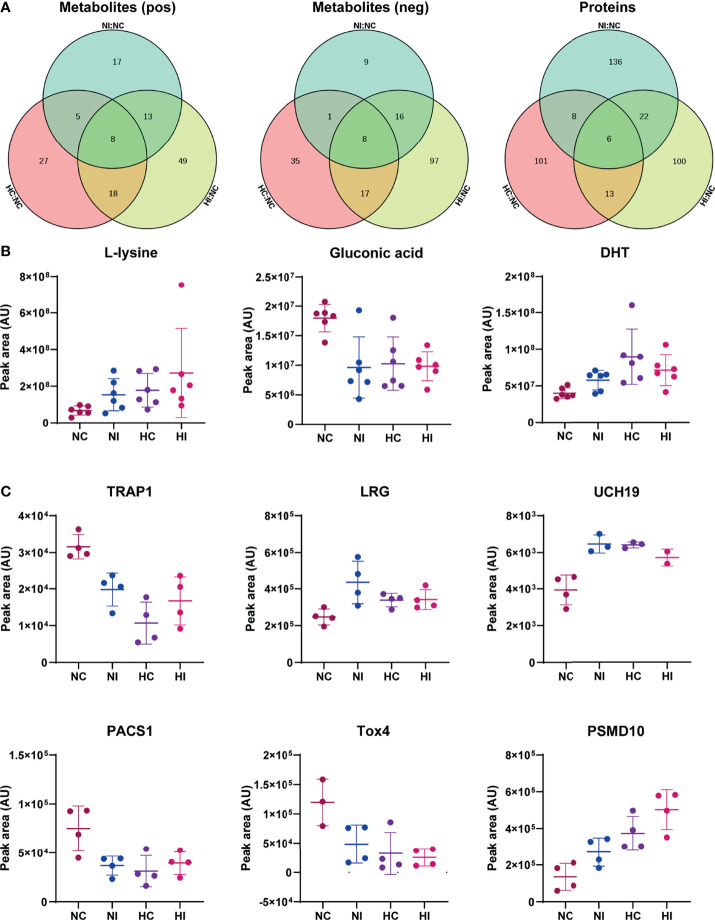
Figure 5.
Common differential metabolites and proteins. The peak area was used for relative quantification. (A) Venn diagram of differential metabolites of the three compared groups (NC versus NI, NC versus HC, NC versus HI) in positive ion scanning mode; Venn diagram of differential metabolites of the three compared groups in negative ion scanning mode; Venn diagram of differential proteins of the three compared groups. (B) Three of the common differential metabolites. DHT: 5α-dihydrotestosterone. (C) The common differential proteins. TRAP1, TGF-β receptor-associated protein 1; LRG, leucine-rich alpha-2-glycoprotein; UCH19, ubiquitin C-terminal hydrolase 19; PACS1, phosphofurin acidic cluster sorting protein 1; Tox4, TOX high mobility group box family member 4; PSMD10, 26S protein non-ATPase regulatory subunit 10; AU, arbitrary unit. Error bars on graphs indicate mean ± SD.

