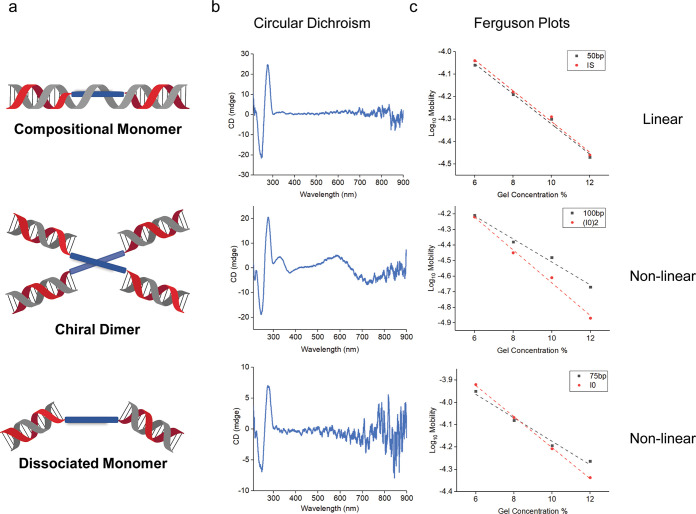
Figure 2.
Characterization of octaniline–DNA chiral dimer and two different monomers. (a) Schematic depiction of octaniline–DNA chiral dimer and two monomers. (b) Circular dichroism of dimeric and monomeric octaniline–DNA constructs. (c) Ferguson plots used to reveal the shape of different constructs, in comparison to similarly sized linear DNA duplexes.

