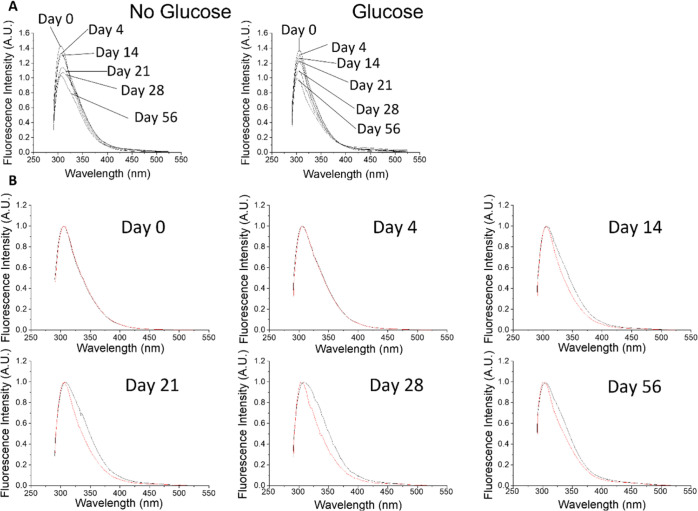
Figure 1.
Fluorescence emission spectra for free collagen and collagen–glucose when excited at 280 nm. (A) Fluorescence changes over time for collagen and collagen–glucose at days 0, 4, 14, 21, 28, and 56. (B) Collagen (black) and collagen-glucose (red) on days 0, 4, 14, 21, 28, and 56, with both samples’ spectra normalized to their peak fluorescence.

