FIGURE 4.
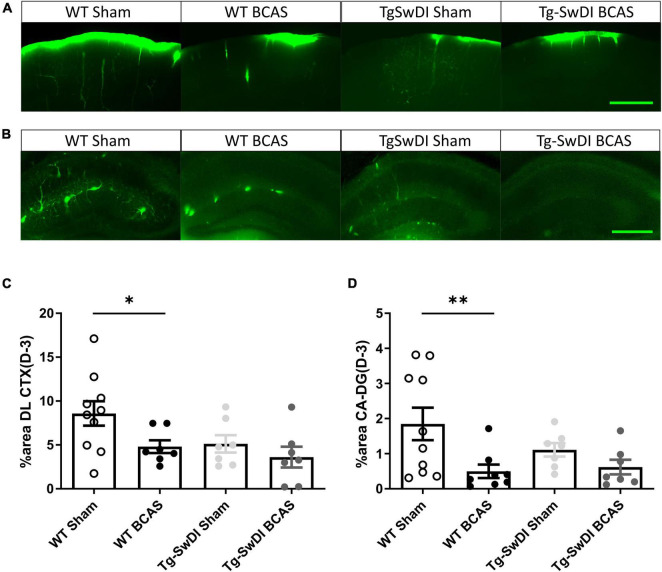
Regional CSF tracer influx is altered in BCAS and Tg-SwDI mice. Representative images of fluorescent tracer influx (D-3) (green) in the (A) DL CTX and (B) hippocampus (CA1-DG molecular layer) of WT and Tg-SwDI mice sham and post-BCAS. (C,D) Quantification of D-3 tracer distribution in the DL CTX and CA1-DG molecular layer. * and ** indicate p < 0.05 and 0.01, respectively. Data are shown as individual data points, mean ± SEM, n = 6–10 per group. Scale bar = 500 μm.

