Fig. 4.
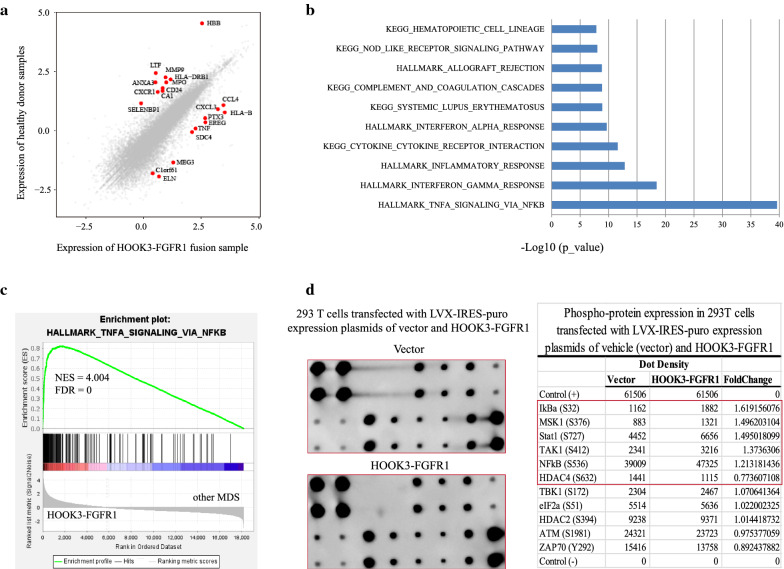
HOOK3-FGFR1 fusion gene involved in the activation of NF-kappaB signaling pathway. a Comparative analysis of the HOOK3-FGFR1 positive patient (Case 1) and healthy donors (n = 8). The texts in the scatterplot correspond to the top 10 up-regulated and down-regulated genes (fold change > 2 and p < 0.01). b Bar plot of the differentially expressed genes from the comparison of the HOOK3-FGFR1 positive patient and healthy donors (FC > 2 and Q < 0.05) enriched in MSigDB. c Representative GSEA plots of one HOOK3-FGFR1 positive patient compared with the 19 HOOK3-FGFR1 negative MDS patients. The normalized enrichment score (NES) and nominal p-values are shown in the graph. d RayBiotech NF-kappaB Pathway Phosphorylation Array including 11 proteins was used to analyze the phosphorylation status of the signaling proteins of 293 T cells transfected with LVX-IRES-puro expression plasmids of vehicle (vector) and FLAG-HOOK3-FGFR1, respectively. Visualization and quantification of the results were performed using a Typhoon 7000 phosphorimager (GE Healthcare) and NIH ImageJ software. Left panels: images of the original blots; right panel: quantitative results. The fold change in the phosphoproteins of FLAG-HOOK3-FGFR1 was calculated relative to the vector

