FIGURE 3.
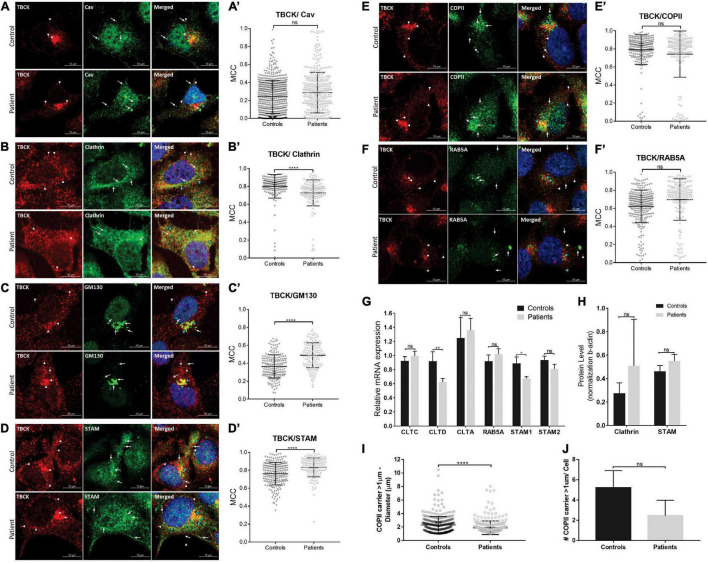
Patient-derived iNPC show altered colocalization levels with endocytic and early secretory pathway markers. (A–F) Representative images of confocal microscopy of iNPC coimmunostained for endogenous TBCK and specific vesicle transport machinery components: (A) Caveolin (Cav), (B) Clathrin, (C) GM130/GOLGA2, (D) STAM, (E) COPII, and (F) RAB5A. For more detailed images, see Supplementary Figure 5. White arrowheads indicate TBCK dots; white arrows indicate the vesicle transport regulators indicated on each image; blue arrows indicate the colocalized dots. (A′–F′) Graphs of Manders coefficient colocalization (MCC) of TBCK with each target protein. Measurements were performed using ImageJ/Fiji-Coloc2 plugin. Error bars indicate SD (each dot represents the MCC in each cell; data represent the analysis of n > 150 cells/individual). (G) Relative mRNA expression of vesicle transport regulators in iNPC grown as neurospheres show reduced clathrin heavy chain CLTD and STAM1 transcript levels in neurospheres of patients, compared with neurospheres of controls. (H) Clathrin and STAM immunoblot densitometries reveal a tendency to increase protein levels in neurospheres of patients, compared with neurospheres of controls. (I,J) Analysis of large COPII carrier (>1 μm) average diameter (I) and number per cell (J). ****p-value < 0.0001. Unpaired t-test, two-tailed. Data are shown as mean ± SD of biological replicates. 4′,6-diamidino-2-phenylindole (DAPI) (blue) marks cell nuclei. Scale bar = 10 μM. Patients: F6331-1 and F6331-4 (N = 2); controls: F7007-1, F8799-1, and F10006-1 (N = 3). *p-value < 0.05, **p-value < 0.01, ns - not significant.

