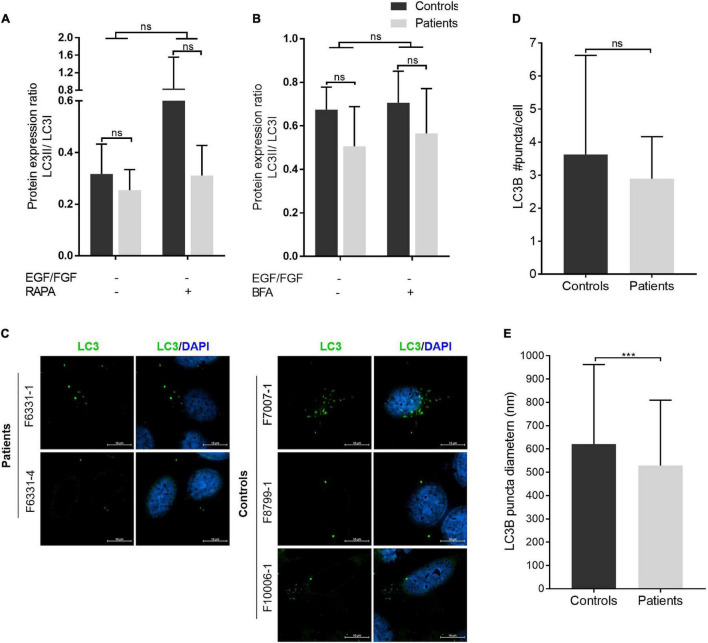
FIGURE 4.
Autophagosome biogenesis analysis: LC3B puncta diameter is reduced in patient-derived iNPC. (A,B) Graphs show the densitometries of immunoblots shown in Supplementary Figure 4. Patients are represented in gray ray bars and controls in black bars. Graphs show the LC3A-B II/I ratio from iNPC cultivated under normal growth conditions and under stress-inducing conditions: absence of EGF and fibroblast growth factor-2 (FGF-2) for 24 h and (A) concomitant treatment with rapamycin (100 nM) for 24 h, and (B) subsequent treatment with BFA (4 μM) for 3 h. β-actin was used as a loading control. Graphs are represented in arbitrary units. (C–E) Immunostaining analysis of endogenous LC3B by confocal microscopy. Representative images are presented in panel (C); average LC3B puncta diameter (nm) in panel (D); and an average number of LC3B puncta per cell in panel (E). ***p-value < 0.001; n.s.—not significant. Data are shown as mean values ± SD of biological replicates. Patients: F6331-1 and F6331-4 (N = 2); controls: F7007-1, F8799-1, and F10006-1 (N = 3).

