Figure 6.

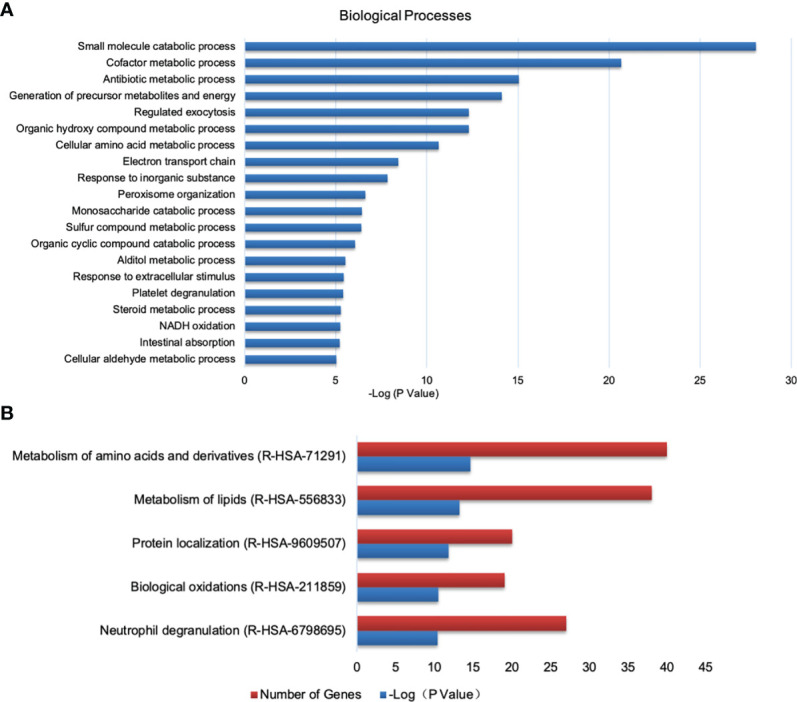
Analysis of DEPs between the control and PEDV group using GO and Reactome database. (A) Biological processes identified by GO enrichment. (B) The top 5 enriched Reactome pathways.

Analysis of DEPs between the control and PEDV group using GO and Reactome database. (A) Biological processes identified by GO enrichment. (B) The top 5 enriched Reactome pathways.