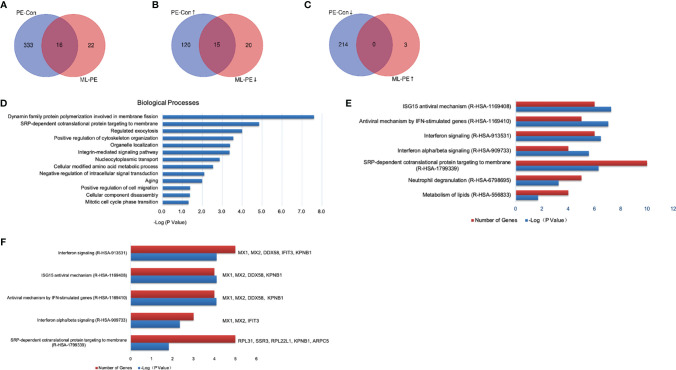
Figure 7.
Comparison and enrichment analysis of DEPs identified among Control, PEDV and ML + PEDV groups. (A) The total number of DEPs in the PEDV vs Control (PE-Con) and ML + PEDV (ML-PE). The overlap indicated the number of common DEPs identified both in the PE-Con and ML-PE groups. (B) The total numbers of upregulated DEPs in the PE-Con group and downregulated DEPs in the ML-PE group. The overlap indicated the numbers of common DEPs that were upregulated in the PE-Con group and downregulated in the ML-PE group. (C) The total numbers of downregulated DEPs in the PE-Con group and upregulated DEPs in the ML-PE group. The overlap indicated the numbers of common DEPs that were downregulated in the PE-Con group and upregulated in the ML-PE group. (D) Enriched biological processes (A, E) the top 5 enriched Reactome pathways of the DEPs between the PEDV group and the ML + PEDV group. (F) Biological process enrichments for the DEPs which were reversely regulated by ML administration. ↑, upregulated; ↓, downregulated.

