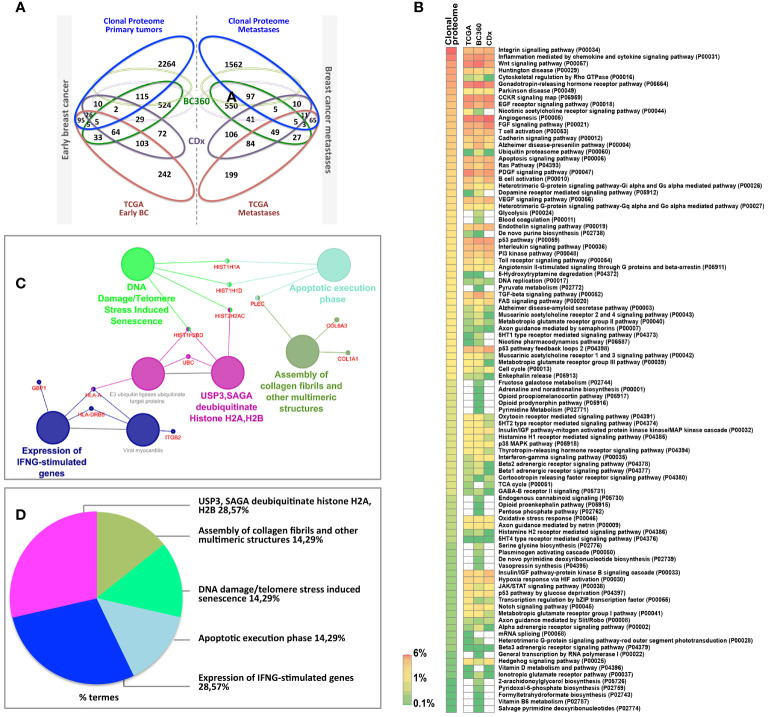
Figure 3.
(A) Venn diagram comparing the clonal proteome dataset with TCGA, BC360 and CDx panels, in primary breast cancer (left) or metastases (right). (B) Panther pathways heatmap showing gene distribution between the datasets. Pathways over-represented are colored in orange and those underrepresented in green. (C) Mutated protein networks and (D) biological processes distribution analyzed using Cytoscape and Cluego.

