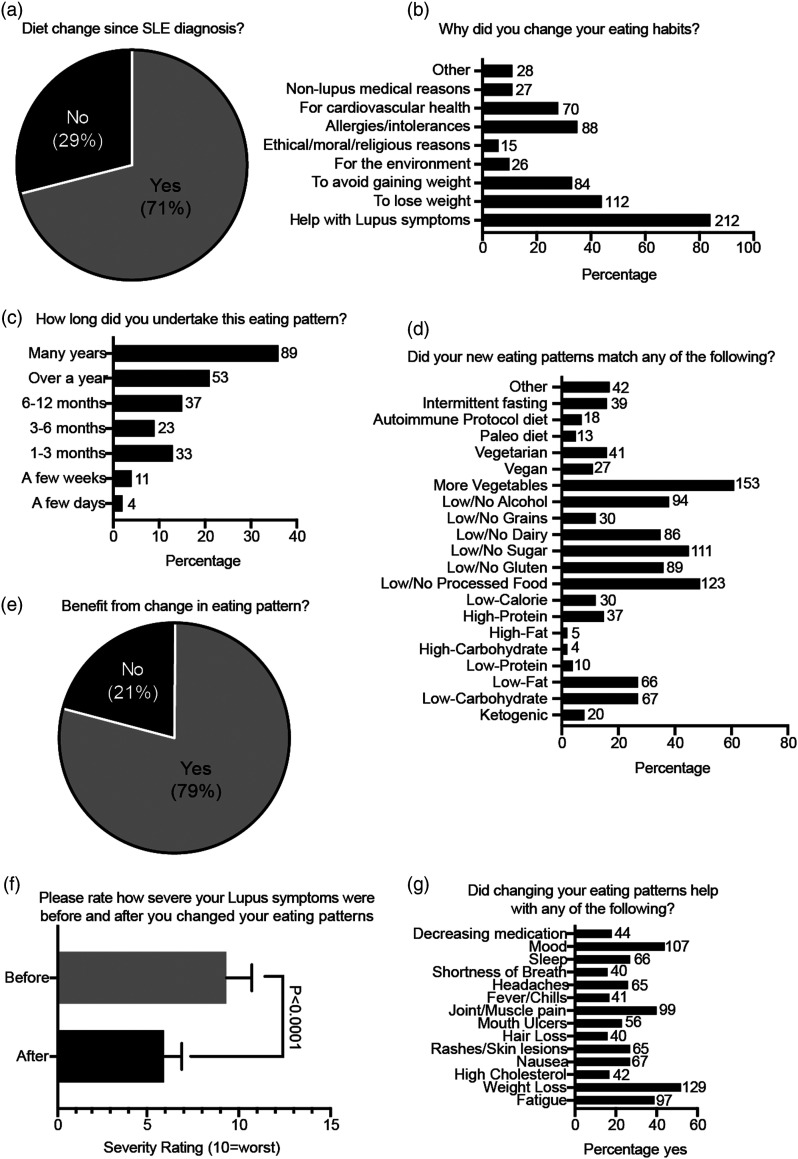
Figure 2.
Patients’ experiences with dietary change and their SLE symptoms. (A–E) Data presented as the percentage of total patients that responded. (F) Paired T-Test, Mean and SEM. (G) Data presented as the percentage of total patients responding ‘yes’. (B–D, G) Number of respondents displayed to the right.

