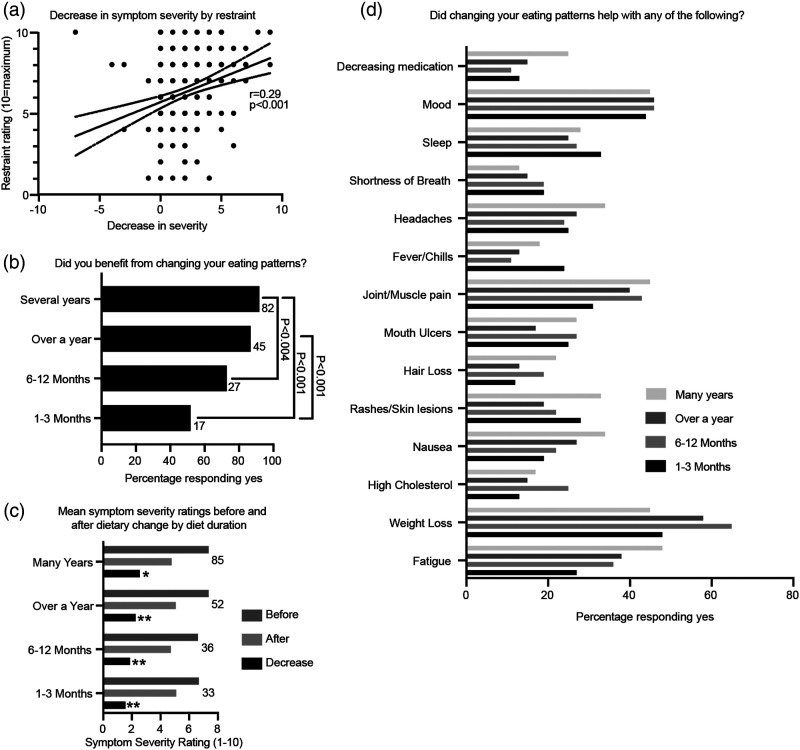
Figure 3.
Patients’ symptom benefits by dietary restraint and length. (A) Scatter plot demonstrating patients’ decrease in symptom severity by their ratings for restraint in eating. Positive x-axis values indicate improvement in symptoms after dietary change. Pearson correlation. (B) Percentage of patients that benefited from dietary change for different diet durations. Number of patients that responded to each option is displayed to the right. Chi-square test. (C) Mean symptom severity ratings before and after dietary change and the decrease in symptom severity by duration of dietary change. Mean. Paired Samples Wilcoxon Signed-Rank Test; *p<0.001; **p<0.0001. (D) Percentage of patients undertaking eating patterns for different durations that responded ‘yes’ when asked whether their new eating patterns helped with specific symptoms.

