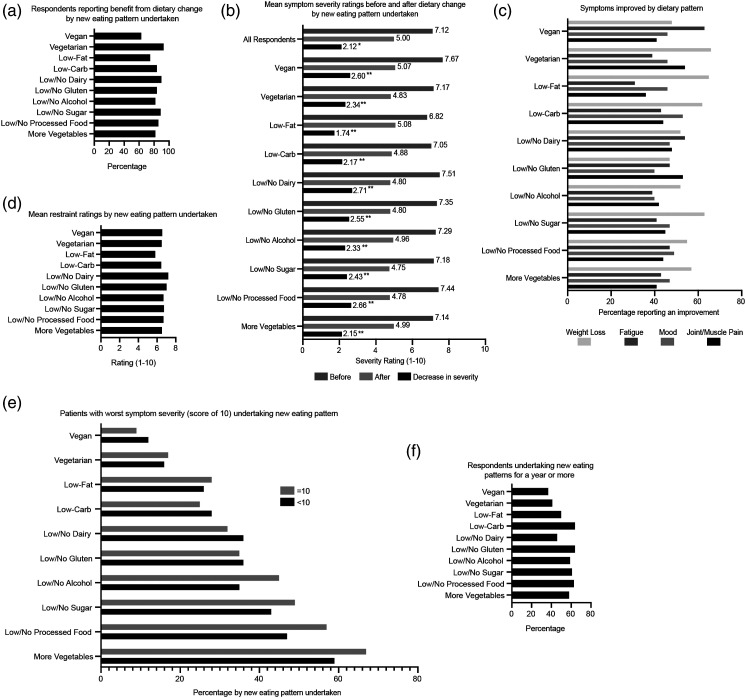
Figure 4.
Patients’ symptom benefits from specific new eating patterns undertaken. (A) Percentage of patients following a certain eating pattern that responded ‘yes’ when asked if they benefited from their dietary change. (B) Patients’ mean symptom severity ratings before and after dietary change by type of new eating pattern undertaken. The difference between these values is displayed as ‘decrease in severity’. Mean. Paired t-test (all-patients) and Paired Samples Wilcoxon Signed-Rank Test; * p<0.0001, ** p<0.00,001. (C) Percentage of patients responding ‘yes’ to whether their new eating patterns helped with fatigue, weight loss, mood or joint/muscle pain by type of new eating pattern undertaken. (D) Mean ratings for restraint in eating by new eating pattern undertaken. 1–10 rating scale, 1 = no restraint, 10 = total restraint. (E) Percentage of patients with the worst symptom severity ratings (score of 10) or score<10 undertaking each new eating pattern. (F) Percentage of patients undertaking dietary change for more than a year by the type of eating pattern undertaken.

