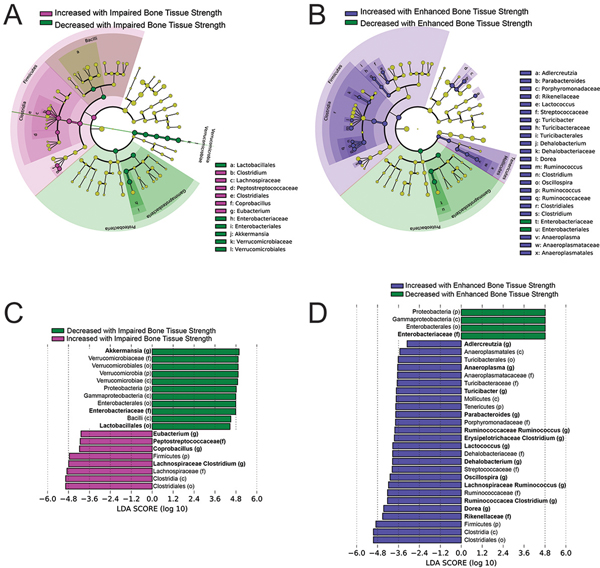
Figure 3:
Results from linear discriminant analysis (LDA) are shown including cladograms (A,B) and LDA scores (C,D). The cladogram shows different taxonomic ranks represented by rings with phyla in the innermost ring and genera in the outermost ring. Colored circles represent individual taxa and are sized in proportion to relative abundance. Features with an effect size greater than |2| are highlighted. The taxa in each level are colored indicating increased or decreased abundance in (A) impaired bone tissue-level strength (neomycin) or (B) enhanced bone tissue-level strength (sweetener) from that in animals with normal bone strength (untreated, ampicillin, vancomycin, metronidazole, LEfSe analysis confirms that the differences between groups are valid for all subgroups). The corresponding LDA scores are illustrated for p <0.05 (C,D) with taxonomic rank is shown in parentheses: (p) phylum, (c) class, (o) order, (f) family, (g) genus. Taxa in bold are lower rank taxa mentioned in the text that appear to dictate the differences at the higher ranks.

