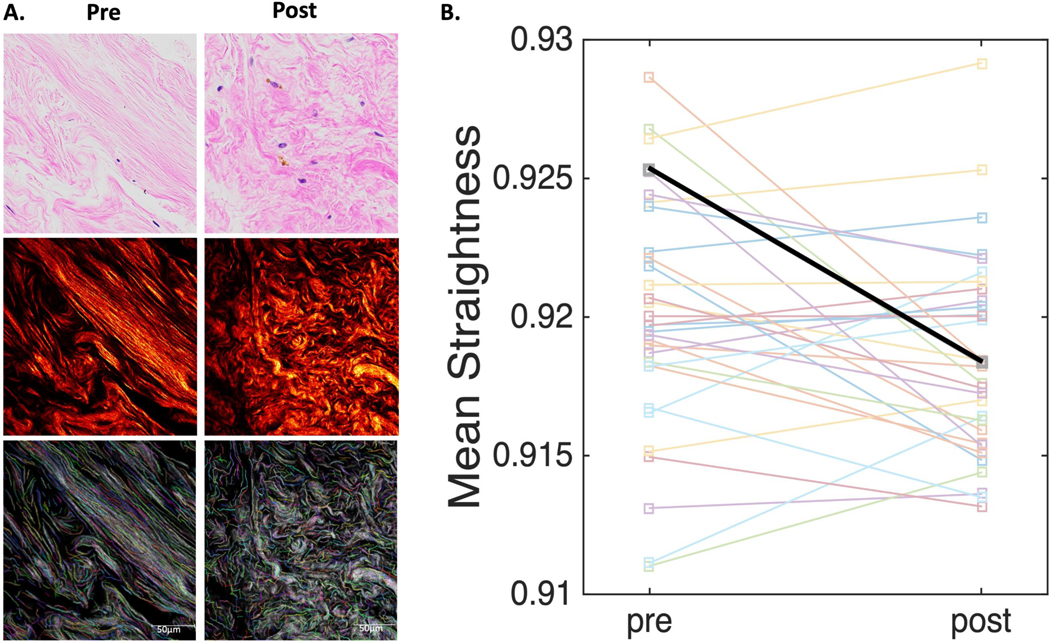
Figure 2. Second-Harmonics Generated (SHG) Microscopy of Breast Tissue Biopsy Samples at Baseline and 6 months after Sulindac Treatment.
Panel A shows a representative breast biopsy tissue section and region of interest from a single patient and mean straightness value before sulindac (left) and 6 months after sulindac (right) stained with hematoxylin and eosin (H&E) under light microscopy (top row), fibrillary collagen SHG image using two-photon laser scanning confocal microscopy with an excitation wavelength of 890 nm (middle) and colorized (middle) the same region of interest post processing using the computer assisted image feature extraction software CT-FIRE. Panel B shows change in mean collagen straightness between baseline and 6 months in 32 pre/post paired sulindac tissue biopsy specimens (unadjusted p value = 0.032). The referenced case highlighted in panel A is represented in the thicker black line in panel B with mean straightness values of 0.925 and 0.918 at baseline and post sulindac, respectively.

