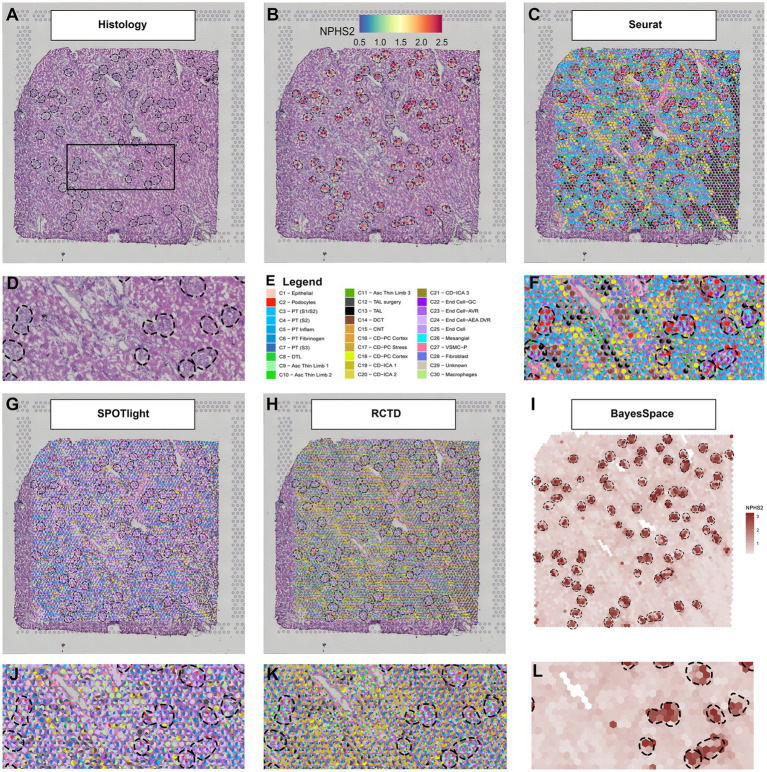
Figure 1.
Deconvolution techniques in spatial transcriptomics. (A) H + E image of a human nephrectomy sample, (B) NPHS2 (podocin gene) expression localizes over glomeruli. (C) Seurat deconvolution in the same nephrectomy field. (D) Magnified field of H + E image. (E) Cell type identity legend. (F) Zoomed image of the Seurat deconvolution. (G) SPOTlight deconvolution. (H) Robust cell type decomposition deconvolution. (I) BayesSpace Deconvolution. (J) Zoomed field of SPOTlight deconvolution. (K) Zoomed field of RCTD. (L) Zoomed field of BayesSpace. Each spot is 55 μm in diameter.

