Figure 1.
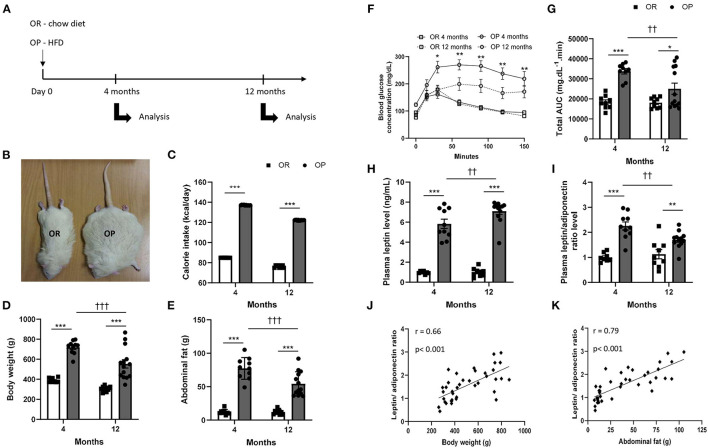
High-fat diet fed obesity-prone (OP) rats present all characteristics of metabolic syndrome after 12 months. (A) Experimental design. Obesity-resistant (OR) and obesity-prone (OP) rats were respectively maintained on normal standard chow or high-fat diet for 4 and 12 months and then analyzed. (B) Representative illustrative picture of high-fat diet fed obesity-prone (OP; on the right) vs. normal chow-fed obesity-resistant (OR; on the left) rats at 12 months. (C) Averaged daily calorie intake evaluated along the 4 and 12 months of the study, in high-fat diet-fed obesity-prone (OP; black bars) vs. normal chow-fed obesity-resistant rats (OR; white bars). Body (D) and total abdominal fat weights (E) of high-fat diet-fed obesity-prone (OP; black bars) vs. normal chow-fed obesity-resistant (OR; white bars) rats at 4 and 12 months. Glycemic response during fasting glucose tolerance test (F) and corresponding total area under the curve [AUC; (G)] in high-fat diet-fed obesity-prone (OP; black bars) vs. normal chow-fed obesity-resistant (OR; white bars) rats at 4 and 12 months. Data are presented as mean ± SEM (n = 8–14 rats per group). *0.01 < p < 0.05, **0.001 < p < 0.01, ***p < 0.001, high-fat diet in obesity-prone (OP) vs. normal chow in obesity-resistant (OR) rats; ††0.001 < p < 0.01, †††p < 0.001, 4- vs. 12-month high-fat diet in obesity-prone (OP) vs. normal chow in obesity resistant (OR) rats. Plasma adipokine profile in high-fat diet-fed obesity-prone (OP) and normal chow-fed obesity-resistant (OR) rats after 4 and 12 months. (H) Plasma leptin levels and (I) leptin-to-adiponectin level ratio in high-fat diet-fed obesity-prone (OP; black bars) vs. normal chow-fed obesity-resistant (OR; white bars) rats at 4 and 12 months. Data are presented as mean ± SEM (n = 8–14 rats per group). ***p < 0.001, high-fat diet in obesity-prone (OP) vs. normal chow in obesity-resistant (OR) rats; ††0.001 < p < 0.01, 4- vs. 12-month high-fat diet in obesity-prone (OP) rats. Correlations between plasma leptin-to-adiponectin ratio and different characteristics of metabolic syndrome, including body weight (J) and total abdominal fat weight (K). Data of all experimental groups and both 4- and 12-month protocol duration were gathered and analyzed together using a parametric Pearson's correlation coefficient analysis.

