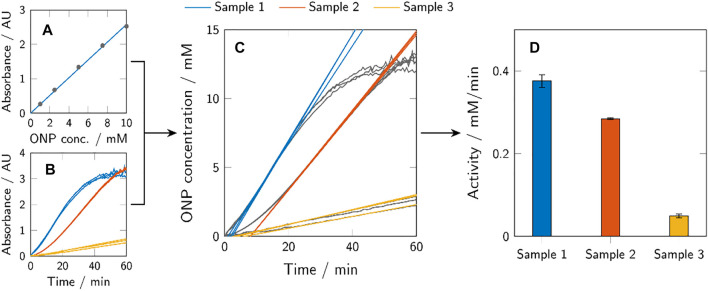
FIGURE 3.
Graphic representation of the activity assay evaluation method. ONP calibration curves were calculated from known ONP samples (A) to transform the obtained absorbance data of the activity assays (B) to ONP concentration profiles over time (C). The maximum activity of a sample (a max) corresponds to the maximum slope of the respective curve and was determined using a 12 min rolling-window analysis. The obtained values of the maximum activity were presented using bar plots (D). Depicted here are generic samples.

