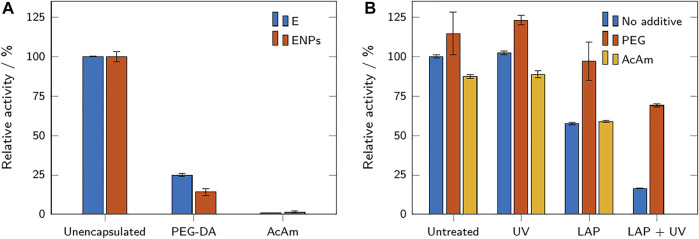
FIGURE 6.
(A) Relative activity of enzymes and ENPs in buffer, compared to PEG-DA and acrylamide-based microparticles containing enzyme and ENPs. The relative activities refer to the respective free (not encapsulated) samples. (B) Relative activity of free enzyme with and without additives after exposure to the photoinitiator LAP and UV light. The relative activities refer to the untreated sample without additive. All results are shown as mean values ± standard deviation (n = 3).

