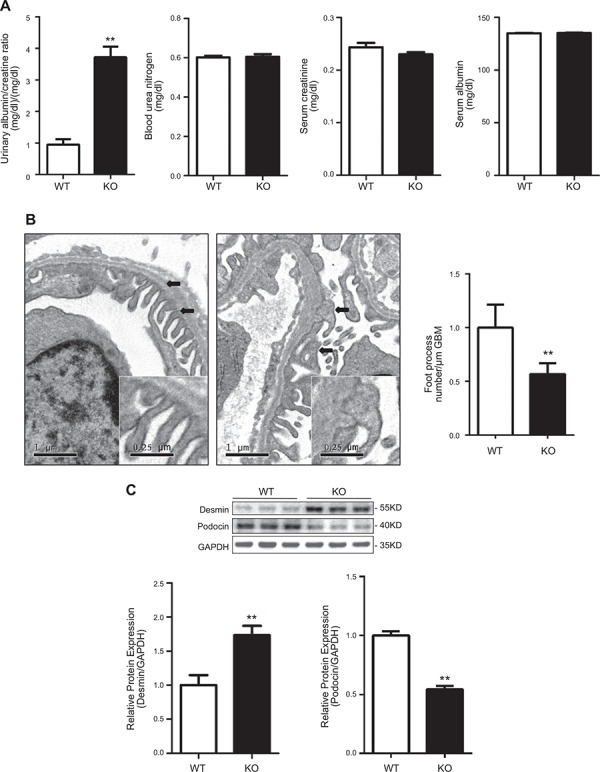
Figure 5.

SGK3 KO mice exhibit a subtle but significant increase in albuminuria with fusion of the foot processes. A) Plasma urea nitrogen, creatinine, albumin, and the urinary albumin/creatinine ratio were measured in SGK3 KO and WT mice. B) Left: electron microscopy was performed to assess ultrastructural changes in podocyte morphology. Representative images are shown from 4 mice in each group. Black arrows indicate the change in podocyte foot process morphology. Right: absolute count of the number of foot processes per unit length of glomerular basement membrane on electron micrographs of kidney specimens. C) Top: Immunoblot analysis for desmin and podocin expression; GAPDH was used for normalization. Bottom: quantification of desmin and podocin by densitometry. GBM, glomerular basement membrane. Data are given as means ± se (n = 6/group). **P < 0.01 vs. SGK3 WT group.
