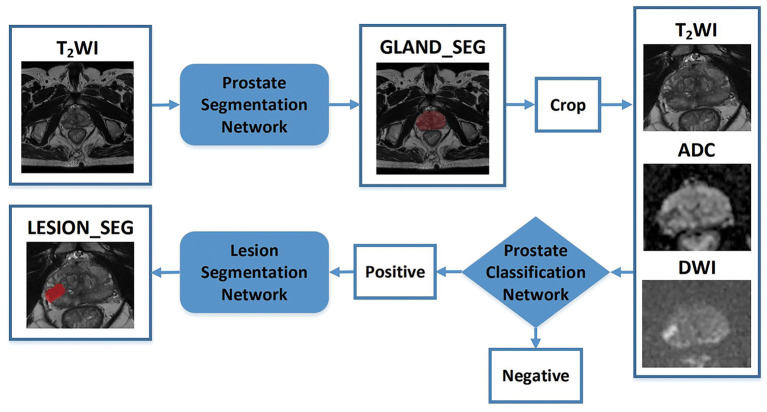
Figure 3.
Flowchart of the study. The blocks highlighted in blue (prostate gland segmentation network, prostate cancer classification network, prostate cancer segmentation/detection network) denote network models used in our study. “Crop” represents a fixed size region of interest (ROI) to crop the prostate gland according the result of the prostate gland segmentation network. The cropped ROI of ADC and DWI would be registered to the cropped ROI of the T2-weighted imaging (T2WI) and then three cropped ROI would be fed into the prostate cancer classification network. “Positive” represents the positive output of the classification network; in that case, the cropped ROI would be fed into the prostate cancer segmentation network to obtain the lesion region. “Negative” represents the negative output of the classification network; in that case, the cropped ROI would not be fed into the prostate cancer segmentation network.

