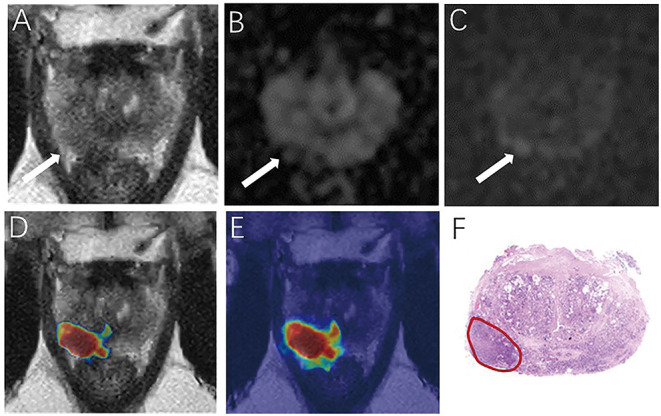
Figure 5.

Demonstrate representative prostate cancer (PCa) example of radiologists negative (A–C) and deep learning (DL) model positive (D,E). Images show a case of DL model segmentation in a 60-year patient in a test set with prostate-specific antigen (PSA) of 5.59 ng/mL. Axial T2-weighted image (A) shows an ill-defined area of little low signal in the right peripheral zone (arrow), with slight restricted diffusion on apparent diffusion coefficient (ADC) maps (B). (C) Diffusion weighted imaging (DWI) (b-value 1,500 sec/mm2) shows slightly increased signal in this region, with an obvious conspicuity over background normal signal; this lesion would be PI-RADS score 3 for magnetic resonance imaging (MRI). (D,E) show overlapping areas between DL focused PCa region and genuine cancer location. The overlapped areas are colored in red. The software ITK-SNAP was used to open the probability map and MR images at the same time. Through the software function, the probability map is displayed as a jet type color map and overlappedon the T2 weighted imaging (T2WI) to obtain (E); The window width and window level of the probability map is adjusted to 0.5 and 0.75 respectively to display the probability map of the detected cancer area and overlapped on the image to obtain (D).
