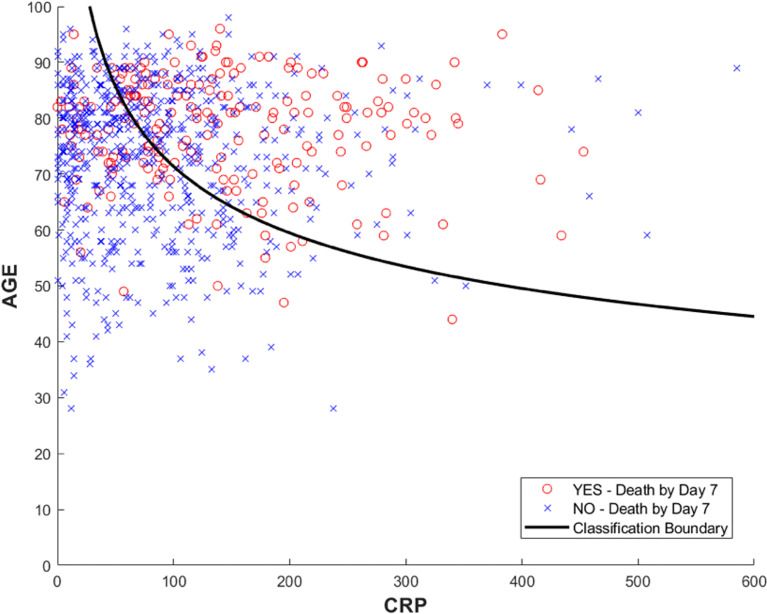
Figure 2.
The figure shows the individual values in the training data for Age and CRP colour coded for outcome, with observed death by day 7 from admission highlighted in red. The curved line shows where the logistic regression model prediction is equal to the prevalence of events on the training data. The curved boundary results from the use of logarithmically transformed variables in the original logistic regression model. Stratifying the observations to the right of the curve and those to the left into high- and low-risk cohorts results in an odds ratio of 3.44 [2.17, 5.44] for the increase in probability of death by day 7.

