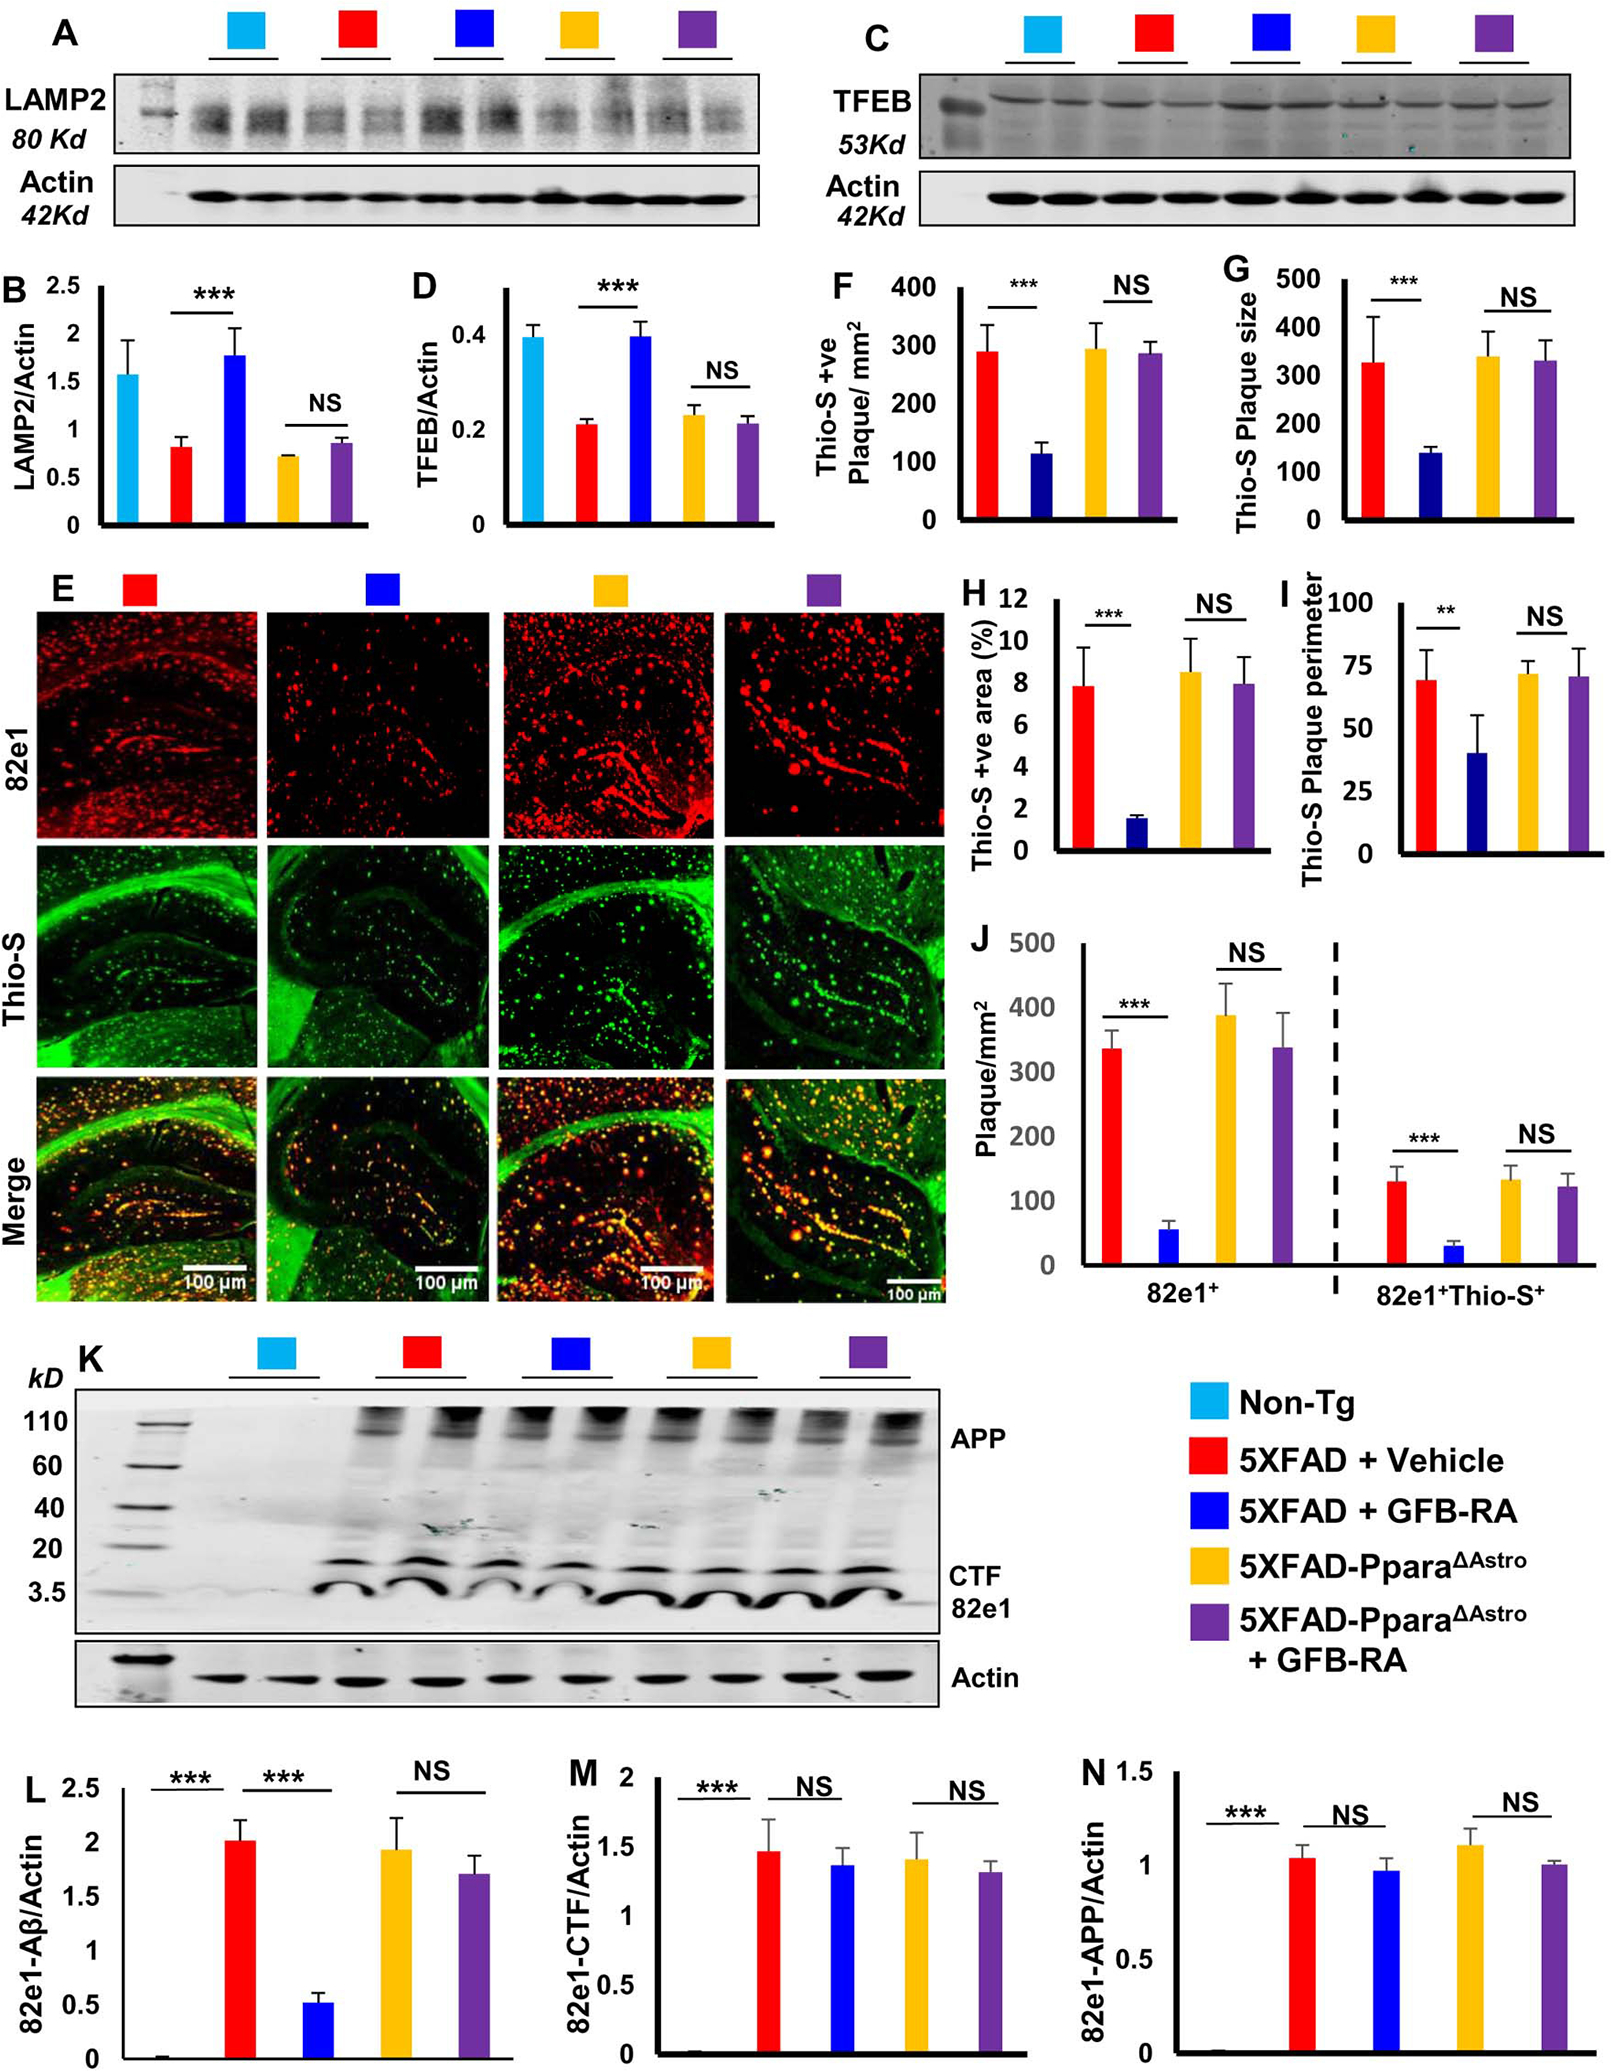
Figure 7. GFB-RA treatment mitigates Aβ plaque load in 5XFAD mice via astrocytic PPARα.

(A to D) Immunoblotting and analysis of TFEB and LAMP2 protein levels in hippocampal homogenates from 6-month-old 5XFAD (n=6/group in two independent experiments) and 5XFAD-PparaΔAstro mice (n=7/group in two independent experiments) orally administered with GFB-RA (8 mg/Kg/day gemfibrozil and 150 IU/day retinoic acid) or vehicle (0.5% methylcellulose) for two months. Label color code: bottom right. (E to J) Imaging of Thio-S (green) and 82e1 (red) staining on hippocampal sections from all groups described in (A to D), analyzed for density (F), size (G), area (as percentage of total area in cortex and hippocampus; H) and perimeter (I) of Thio-S-positive plaques, as well as (J) number of 82e+ and 82e+Thio-S+ plaques in one section (3 images per section) of each of five mice per group. Scale bars as marked. (K to N) Immunoblotting and analysis of Aβ plaques in the above-described tissues using 82e1, quantified relative to actin. Data are mean ± SEM of five mice per group. *P<0.05, **P<0.01, ***P<0.001, and NS denotes not significant by one-way ANOVA followed by Tukey’s multiple comparison test.
