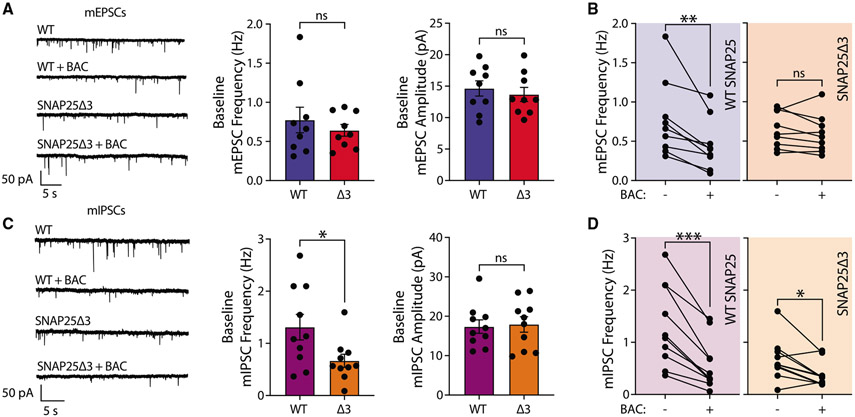
Figure 3. SNAP25Δ3 prevents baclofen-mediated inhibition of excitatory, but not inhibitory, spontaneous release.
(A) Representative traces of mEPSCs recorded at baseline and during 10 μM BAC perfusion along with quantitative analysis of event frequencies and amplitudes at baseline for WT SNAP25 control and SNAP25Δ3 (two-tailed, non-paired t test; WT n = 9; Δ3 n = 9).
(B) Quantitative analyses of mEPSC frequencies at baseline and during 10 μM BAC perfusion for WT SNAP25 control and SNAP25Δ3 (two-tailed, paired t test; WT n = 9; Δ3 n = 9).
(C) Representative traces of mIPSCs recorded at baseline and during 10 μM BAC perfusion along with quantitative analysis of event frequencies and amplitudes at baseline for WT SNAP25 control and SNAP25Δ3 (two-tailed, non-paired t test; WT n = 10; Δ3 n = 10).
(D) Quantitative analyses of mIPSC frequencies at baseline and during 10 μM BAC perfusion for WT SNAP25 control and SNAP25Δ3 (two-tailed, paired t test; WT n = 10; Δ3 n = 10).
All panels: significance levels are stated as follows: *p < 0.05; **p < 0.01; ***p < 0.001; and ****p < 0.0001.

