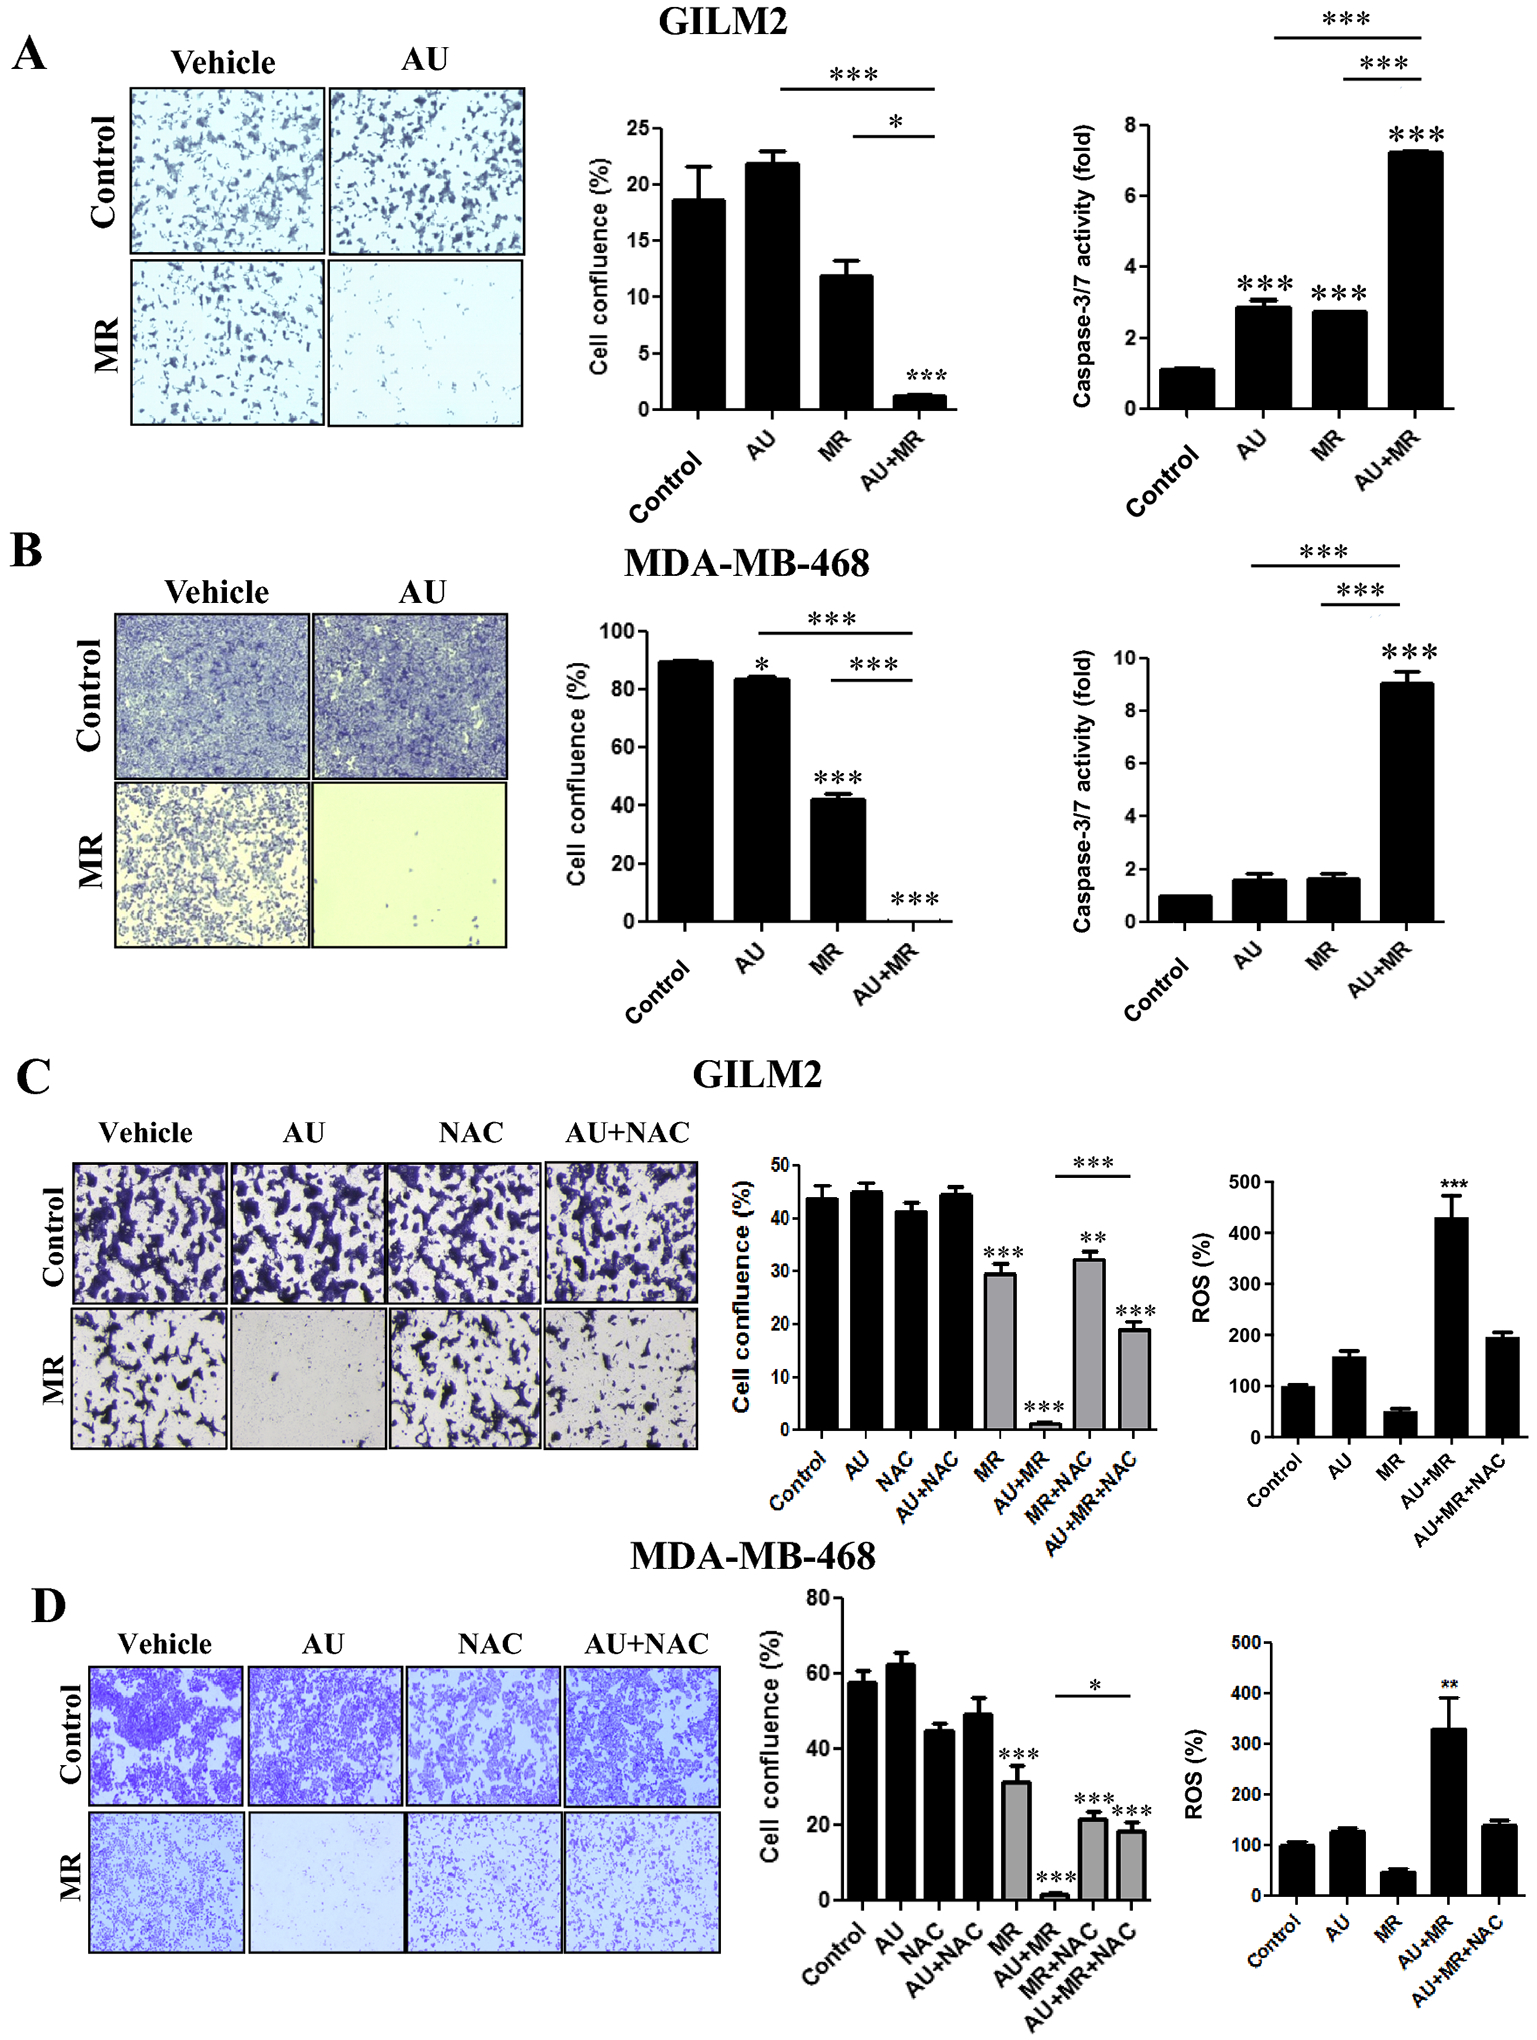
Fig. 3. Methionine restriction sensitizes TNBC cells to auranofin by an ROS-dependent mechanism.

A and B, Crystal violet cell survival assay of GILM2 (A) and MDA-MB-468 (B) TNBC cells grown in control or MR media for 72 hours and treated with vehicle or auranofin (1 μM) for the final 24 hours. Left panel: representative images. Middle panel: quantification of percentage confluence performed by counting cells in 3 fields of each well (mean ± SEM, n = 3). Right panel: GILM2 (A) and MDA-MB-468 (B) TNBC cells grown in control or MR media for 72 hours, treated with vehicle or auranofin (1 μM) for the final 24 hours, and caspase-3/7 activity was measured (expressed as fold control, mean ± SEM, n=3). C and D, Crystal violet cell survival assay of GILM2 (C) and MDA-MB-468 (D) TNBC cells cultured in control or MR media for 72 hours in presence or absence of NAC (2 mM) and treated with vehicle or auranofin (1 μM) for the final 24 hours. Left panel: representative images. Middle panel: quantification of percentage confluence performed by counting cells in 3 fields of each well (mean ± SEM, n = 3). Right panel: GILM2 (C) and MDA-MB-468 (D) cells were grown in control or MR media for 72 hours, treated with vehicle or auranofin (1 μM) for the final 24 hours, and ROS levels (expressed as percentage control) were determined (mean ± SEM, n = 3). In all panels, *, P < 0.05, **, P < 0.01, ***, P < 0.001 vs. control or the indicated comparison
