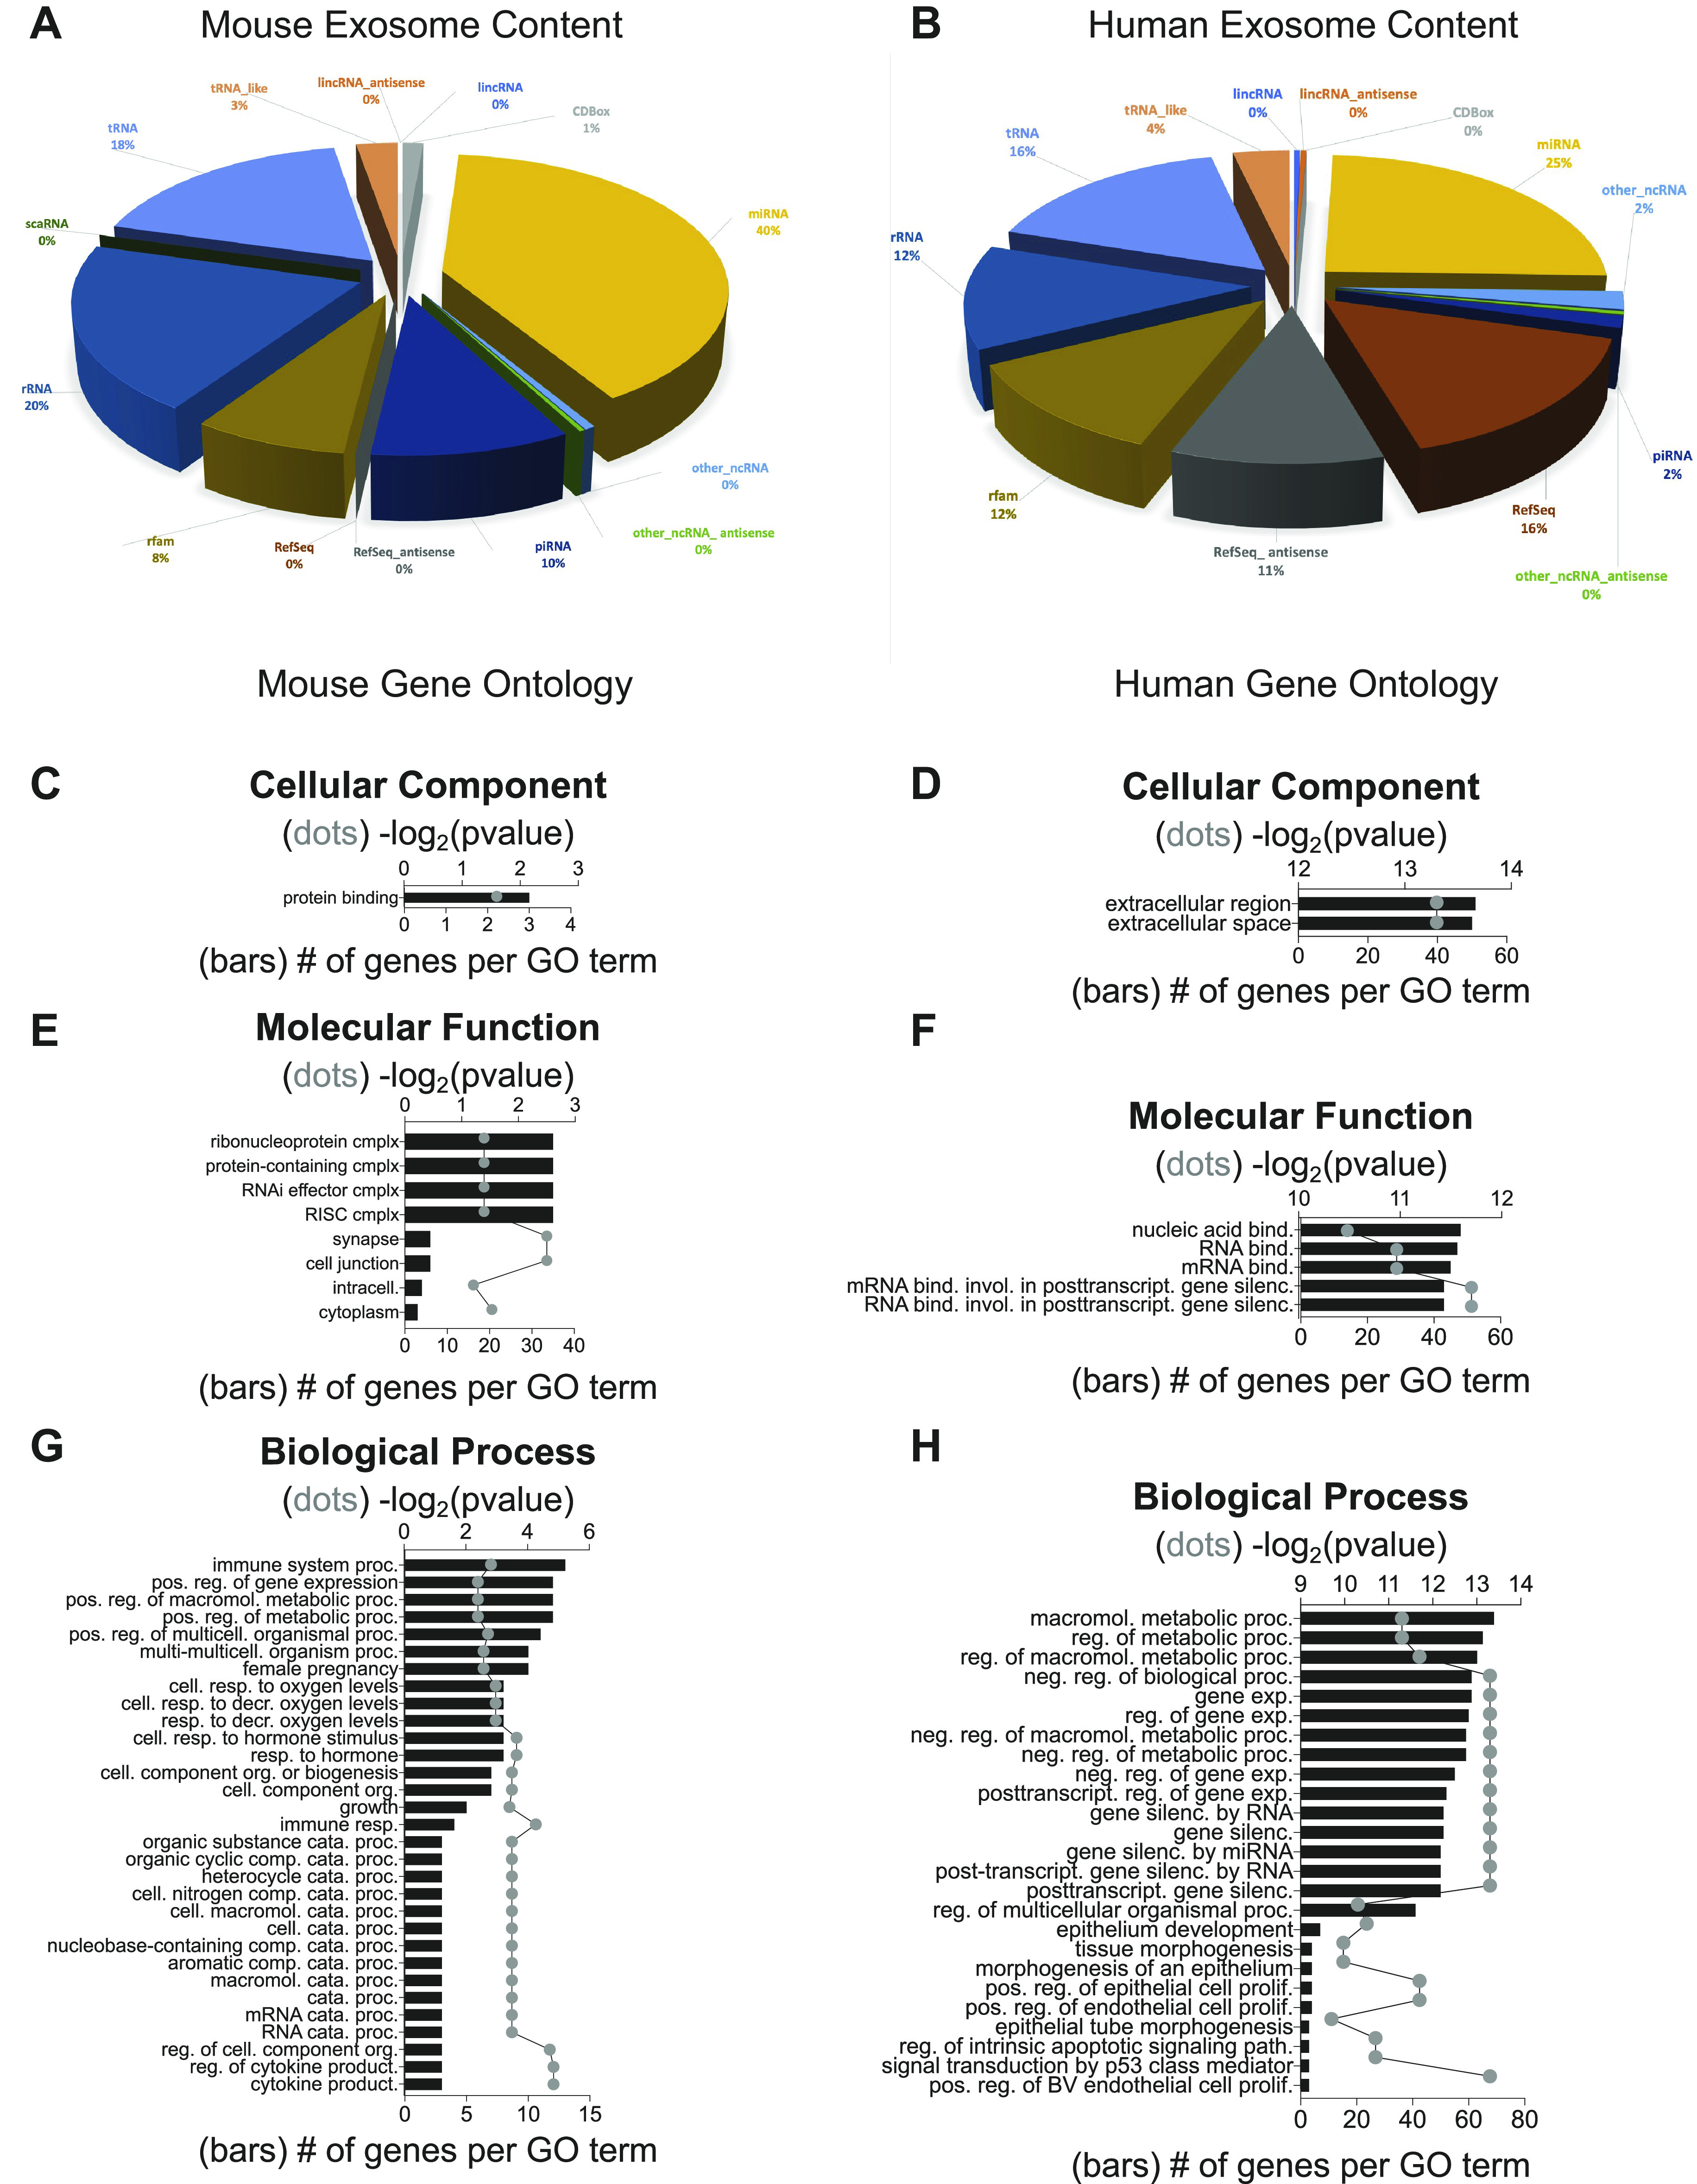
Figure 7.

Exosomal RNA content from mCBSC-dEXO and hCBSC-dEXO differs in both RNA species percentages and gene ontology (GO) enrichment. Small RNASeq analysis of RNA content from mCBSC-dEXOs and hCBSC-dEXOs. A: pie chart of RNA species quantities in mCBSC-dEXOs. B: pie chart of RNA species quantities in hCBSC-dEXOs. Gene ontology for mCBSC-dEXO cellular component (C), hCBSC-dEXO cellular component (D), mCBSC-dEXO molecular function (E), hCBSC-dEXO molecular function (F), mCBSC-dEXO biological process (G), and hCBSC-dEXO biological process (n = 4 for each group; H). CBSCs, cortical bone stem cells; hCBSC-dEXO, human CBSC-derived exosome; mCBSC-dEXO, mouse CBSC-derived exosomes.
