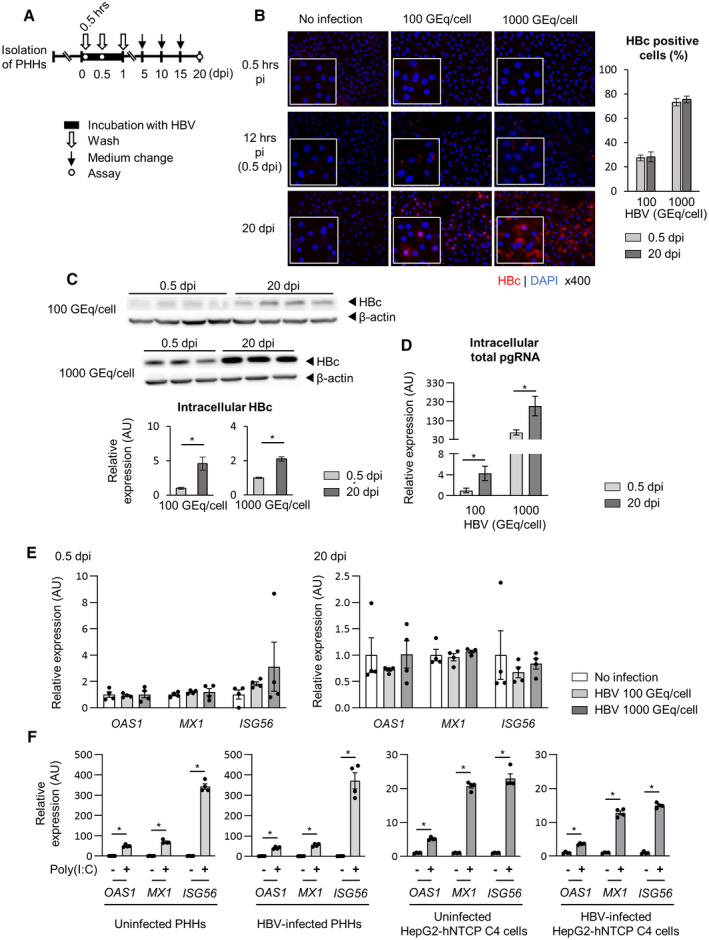
FIG. 1.

Intracellular ISG expression is not altered by HBV infection. (A‐E) PHHs isolated from human liver–chimeric mice were inoculated with HBV (100 GEq/cell or 1,000 GEq/cell), and the HBc‐positive cell ratio, intracellular pgRNA levels, and antiviral ISG expression levels were evaluated at indicated times. Each samples were analyzed after washing. (A) Schematic of the experimental procedure. (B) Representative image of fluorescence immunostaining (red, HBc; blue, nucleus). The HBc‐positive cell ratio was calculated based on the average of four fields of view. (C) Western blot of intracellular HBc protein and its quantifications (n = 3‐4). (D) Intracellular total pgRNA levels (n = 4). (E) The mRNA expression levels of antiviral ISGs (n = 4). Dot plot shows individual values. (F) Uninfected PHHs or HBV‐infected PHHs at 20 dpi were transfected with 0.01 μg/mL Poly (I:C). Two days later, the mRNA expression levels of antiviral ISGs were measured (n = 4). For reference, uninfected HepG2‐derived NTCP‐expressing cells (HepG2‐hNTCP C4 cells) or HBV‐infected (5,000 GEq/cell) HepG2‐hNTCP C4 cells at 8 dpi were transfected with 0.1 μg/ml Poly (I:C). Two days later, the mRNA expression levels of antiviral ISGs were measured (n = 4). Dot plot shows individual values. The data are shown as the mean ± SEM. *P < 0.05.
