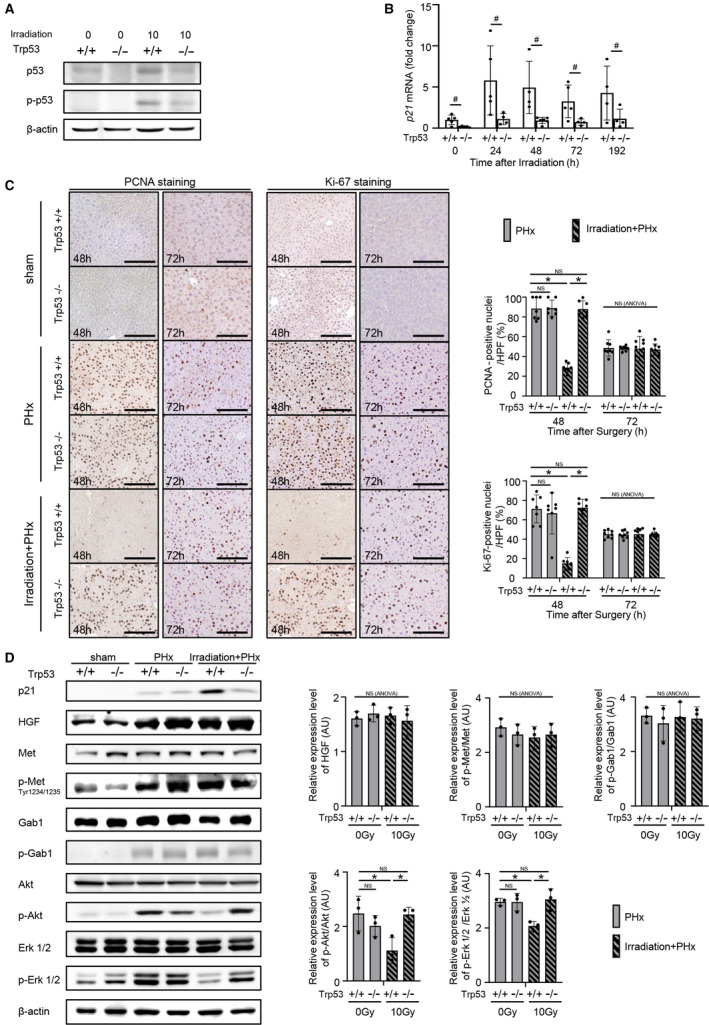
FIG. 4.

Hepatocyte‐specific p53 KO abolishes irradiation‐induced impairment in liver regeneration. (A,B) Male p53 KO and littermate WT mice were irradiated with 10 Gy. (A) Protein expression levels of p53 and phospho‐p53 (Ser15) in the liver at 1 hour after irradiation were assessed by western blot analysis. (B) mRNA expression levels of p21 in the liver at the indicated times after irradiation were quantified by quantitative RT‐PCR (n = 5, 5, 4, 5, and 4 WT mice [+/+] and 5, 4, 6, 4, and 4 KO mice [−/−] at 0, 24, 48, 72, and 192 hours after irradiation, respectively); # P < 0.05 based on the unpaired Student t test. (C,D) Male p53 KO and littermate WT mice were randomly assigned to the following three groups: nonirradiated mice subjected to sham operation 24 hours later (sham group), nonirradiated mice subjected to PHx 24 hours later (PHx group), irradiated mice with 10 Gy subjected to PHx 24 hours later (irradiation+PHx group) (n = 5, 6 WT mice and 5, 6 KO mice for sham; 7, 8 WT mice and 7, 8 KO mice for PHx; 7, 9 WT mice and 7, 8 KO mice for irradiation+PHx; at 48 and 72 hours after surgery, respectively). (C) Representative images of liver sections stained with anti‐PCNA and anti‐Ki‐67 antibodies at 48 and 72 hours after surgery with or without irradiation are shown; original magnification ×200. The percentages of PCNA‐ and Ki‐67‐positive nuclei/HPFs are reported. Ten fields of view were counted in the liver sections of individual mice. (D) Expression levels of cell‐growth‐related proteins in the liver at 48 hours after surgery were assessed by western blotting analysis. Relative expression levels of proteins in the hepatectomized mice were normalized to expression levels in sham‐operated WT mice; *P < 0.05 based on the Tukey‐Kramer method; NS based on one‐way ANOVA. Data show mean (bar) ± SD. Abbreviation: HPF, high‐power field.
